All published articles of this journal are available on ScienceDirect.

Implementation of Mechanistic-Empirical Pavement Design Guide against Indonesian Conditions using Arizona Calibration
Abstract
Background:
As a transportation infrastructure that connects one area to another, roads have an essential role in economic and social growth, together with establishing a location that may improve the quality of life in the surrounding community. For this reason, it is necessary to perform road maintenance when the structural or functional capacity of the road is inadequate, one of which is by overlaying the road.
Objective:
The main objective of this research is to determine the thickness of the flexible pavement overlay and subsequently examine the damage model produced by the 2015 MEPDG method with Arizona calibration. This study also proposes recommendations for implementing the 2015 MEPDG procedures in Indonesian settings.
Methods:
The thickness of the road overlay can be designed through a mechanistic-empirical approach, which is commonly referred to as the Mechanistic-Empirical Pavement Design Guide (MEPDG). The back calculation on the BAKFAA program was utilized to examine the existing situation. At the same time, a stress-strain analysis was performed using the KENPAVE software to calculate the response of the pavement structure.
Results:
The 2015 MEPDG with Arizona calibration by controlling fatigue cracking has resulted in an overlay thickness of 180 mm. In addition, the damage model was obtained for each type of road failure and can be beneficial in estimating the future IRI value.
Conclusion:
The damage model generated from the 2015 MEPDG procedure is specific to the types of road damage, which can eventually be utilized to predict the future IRI value. It also encompasses local and global calibration variables, such as adjustment factors for its implementation in road pavement conditions in Indonesia. The MEPDG application can be simplified by shortening the mechanistic analysis process, along with reducing traffic variations and the level of detail in the daily climate analysis.
1. INTRODUCTION
Along with the development of new technology, pavement evaluation and design techniques began to move into the era of a Mechanistic-Empirical approach. The Empirical method refers to the results of laboratory or experimental observations, as well as engineering expertise, or a combination of both, represented by equations or formulas to describe the natural ambiance and the correlations between design inputs, including loads, materials, layer configurations, and environment, and pavement failure [1-6]. In contrast, the Mechanistic approach is performed by modeling the pavement as a multilayer structure that responds to repeated loads, aiming to calculate the critical stresses and strains in the pavement [7]. Fundamentally, the Mechanistic-Empirical is a combination of those two methodologies. Some guidelines have currently applied this approach to evaluating and designing flexible pavements; one of them is the Mechanistic-Empirical Pavement Design Guide (MEPDG) developed by the American Association of State Highway and Transportation Officials (AASHTO). The MEPDG establishes a direct tie between pavement distresses and numerous design inputs [8].
The 2015 MEPDG is substantially a road pavement design module that enhances the previous method, the 1993 AASHTO, which uses an integrated analysis technique to estimate pavement deterioration over time [9]. In addition, this guide considers a variety of input parameters that affect pavement performance, such as traffic, climate, pavement structure, and material qualities, and the application of engineering mechanics concepts to forecast essential pavement responses [10]. Hence, several adjustments are required regarding the Road Damage model, including local and global calibration variables. These allow the adaptation to different circumstances, considering each location has its local calibration that can produce a more accurate MEPDG outcome [11]. For example, one of the American states that executed the 2015 MEPDG methodology is Arizona, located in the southern part of America. In fact, a city in Arizona, Phoenix, has a freezing index of 0 (zero), the same as Indonesia [12, 13].
Eventually, applying the MEPDG procedure by calibrating the Indonesia conditions is a fascinating topic to be discussed, especially regarding the damage model used. Therefore, this research aims to evaluate the damage model of the 2015 MEPDG and analyze the thickness of the flexible pavement overlay. Subsequently, the process that should be complied with in adopting the 2015 MEPDG technique to Indonesian cases is also proposed.
The remainder of the paper is structured in the following manner. Section 2 describes the methodology and defines the object of the study. Section 3 contains data analysis, including the existing pavement, traffic performance, climate, and road deflection. Section 4 discusses the mechanistic analysis using the KENPAVE software and the variations of model parameters. Section 5 introduces the 2015 MEPDG design and damage model, as well as the suggested performance criteria. Section 6 elaborates on damage models, such as performance deformation, fatigue cracking, and the International Roughness Index (IRI) model. Section 7 describes the 2015 MEPDG approach to Indonesian conditions and a discussion in Section 8. Finally, conclusions and some recommendations for applying the Mechanistic-Empirical Pavement Design Guide in the case of Indonesia are given in Section 9.
2. METHODOLOGY
There were four main stages conducted in this research. First, secondary data was collected from the National Road Implementation Center (under the Indonesian Ministry of Public Works and Housing) as well as from the Indonesian Meteorology, Climatology, and Geophysics Agency. These data include the existing pavement thickness, traffic volume, climate, and Falling Weight Deflectometer (FWD) deflection data. Furthermore, this first step was also undertaken to analyze the current state and the back-calculation process using the BAKFAA software by the Federal Aviation Administration (FAA). This program is deemed very convenient and user-friendly; also, the desired modulus value can be locked to determine the Root Mean Square (RMS) of the typical one [14]. In general, the back-calculation procedures are as follows:
1. Input the measured deflection of the FWD device, including the load and distance from each detector.
2. Input layer thickness and properties.
3. Input seed modulus, which is used to determine surface deflection in software. Typically, this modulus is computed based on user experience or other formulae.
4. Software-based computation of deflection.
5. Examine the errors resulting from a comparison of the measured and estimated basins.
6. New modulus search. Some back-calculation software has employed various approaches to compute the new modulus of the existing error, resulting in an acceptable difference between the measured and calculated deflection basins.
7. Control the modulus range. In certain back-calculation software, the modulus range (minimum and maximum) is set or calculated to prevent the algorithm from convergent to an unreasonably large modulus.
Second, a mechanistic analysis was conducted using the KENPAVE software by inputting the results from the previous step. This structural condition analysis aims to receive the structural responses from several trials of overlay thicknesses, including stress, strain, and deformation that occur in the flexible pavement structure at the critical points [15, 16]. Fundamentally, KENPAVE is a finite element analysis program developed by Y. H. Huang (1993) [17], which is utilized for designing either flexible or rigid pavement and analyzing the structural response of a pavement model.
The third stage consisted of calculating the damage model according to the thickness of the overlay to obtain the total damage based on the Arizona calibration on the MEPDG approach, with varying overlay thickness. It also produced some additional layers that meet the damage criteria in the 2015 MEPDG damage model. Finally, some conclusions were drawn as consideration for offering recommendations and modifications to the design results, along with some valuable information for further research improvements.
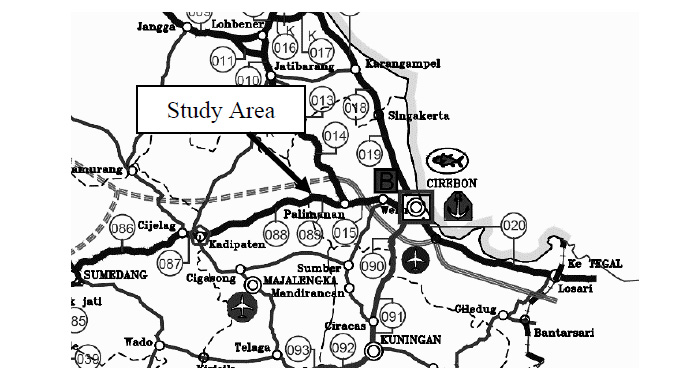
The case of this study is the National Road segment of Majalengka/Cirebon Regency (Sta 8+100) to Palimanan City (Sta 20+400). This road is 20.15 kilometers long, with an undivided two-lane configuration in each direction, a pavement width of 7.00 meters, and an average shoulder width of 1.00 meters. As indicated in Fig. (1) [18], this road section is located in an urban region, with an industrial area connected to Indonesian National Road Route 1 (North Coast) and adjacent to the Cikopo – Palimanan toll road. Heavy vehicles on these highways are typically loaded with cement, sand, and industrial materials.
3. DATA ANALYSIS
3.1. Existing Pavement Analysis
The existing pavement in this research consists of a 30 cm thickness of asphalt layer and a 15 cm grade-A granular aggregate layer. The modulus default values of the road materials for a 30 cm thick asphalt layer are 600 MPa and the Poisson's ratio of 0.35. As for the 15 cm granular layer, the modulus value is 150 MPa with a Poisson ratio of 0.35. Finally, the subgrade has a modulus of 60 MPa and a Poisson ratio of 0.45.
3.2. Traffic Analysis
In this study, the traffic growth factor considered is 4.8%, referred to in the Indonesian Road Pavement Design Manual (2017) [19]. The calculation of vehicle growth is separated into two-periods groups: the 2020 period uses factual loading, whilst the 2021 to 2029 period uses normal predicted loading. This classification is decided based on the government's regulation that no vehicles would exceed the standard vehicle weight or be overloaded by the end of 2020. However, due to data constraints, notably regarding the distribution of axle load per type of axle on each vehicle category, the value of ESA 4 was utilized for traffic loading in the MEPDG approach. Consequently, substituting the number of axle load spectra with ESA will reduce the accuracy of the MEPDG computations, as it only employs a dual-wheel single-axle model. The following Table 1 is the calculation of ESA 4 and ESA 5 from the traffic data in both directions for a design life of ten years.
3.3. Climate Analysis
Climate analysis is performed to identify the Weighted Mean Annual Pavement Temperature (WMAPT). The WMAPT parameter is necessary to correct the FWD deflection data with the annual average pavement temperature (AAPT). Table 2 shows the result of the climate analysis.
| Type | Average Daily Traffic | VDF4 | ESA4 | ||||
|---|---|---|---|---|---|---|---|
| 2019 | 2020 | 2021 | Factual | Normal | 2020 | 2021-2029 | |
| 5B | 63 | 67 | 70 | 1.2 | 1.2 | 1.50E+04 | 1.70E+05 |
| 6A | 1933 | 2026 | 2124 | 0.5 | 0.5 | 1.8E+05 | 2.10E+06 |
| 6B | 1570 | 1646 | 1725 | 4.8 | 1.8 | 1.40E+06 | 6.20E+06 |
| 7A | 1178 | 1235 | 1294 | 16.2 | 3.7 | 3.70E+06 | 9.60E+06 |
| 7B | 24 | 26 | 27 | 12.5 | 5.4 | 5.90E+04 | 2.90E+05 |
| 7C | 74 | 78 | 82 | 8.4 | 4.6 | 1.20E+05 | 7.50E+05 |
| CESA | 5.50E+06 | 1.90E+07 | |||||
| Total CESA | 2.50E+07 | ||||||
| Month | T Average (°C) | WF (°C) | WMAAT (°C) | WMAPT (°C) | Rainfall (mm) |
|---|---|---|---|---|---|
| January | 27.77 | 2.96 | 27.70 | 40.31 | 561.2 |
| February | 27.20 | 2.75 | 27.14 | 39.56 | 590.8 |
| March | 27.70 | 2.93 | 27.63 | 40.22 | 386.8 |
| April | 27.97 | 3.04 | 27.90 | 40.57 | 157.3 |
| May | 28.29 | 3.17 | 28.21 | 40.98 | 138.4 |
| June | 27.78 | 2.96 | 27.71 | 40.32 | 90.3 |
| July | 28.03 | 3.06 | 27.95 | 40.64 | 50.9 |
| August | 28.48 | 3.25 | 28.40 | 41.24 | 8.3 |
| September | 29.89 | 3.90 | 29.77 | 43.05 | 2.2 |
| October | 29.26 | 3.60 | 29.16 | 42.24 | 137.7 |
| November | 28.89 | 3.43 | 28.79 | 41.76 | 203.0 |
| December | 27.01 | 2.68 | 26.95 | 39.31 | 619.0 |
| Average | 3.14 | 28.11 | 40.85 | Total | |
| WMAPT | 41 | 2945.9 | |||
| Segment | Load (kN) | d1 | d2 | d3 | d4 | d5 | d6 | d7 |
|---|---|---|---|---|---|---|---|---|
| micron | ||||||||
| 1N | 37 | 388 | 265 | 197 | 158 | 114 | 90 | 51 |
| 2N | 40 | 208 | 115 | 96 | 83 | 74 | 61 | 52 |
| 1O | 37 | 387 | 265 | 197 | 158 | 114 | 90 | 50 |
| 2O | 40 | 208 | 115 | 96 | 83 | 74 | 61 | 52 |
3.4. Deflection Analysis
The deflection analysis of the FWD measurement consists of three steps: (1) deflection correction to temperature, (2) division of segments, and (3) back-calculation examination of each part. Initially, to correct the deflection results according to temperature, it is required to calculate fT or compare the asphalt temperature during the test to the WMAPT. The outcomes of the fT calculation were then plotted in a graph to generate the deflection correction factor. In the Road Pavement Design Manual [18], the deflection correction factor is obtained from a table based on the fT value and asphalt thickness. Subsequently, the deflection data is segmented, and one representative deflection is taken from each segment for the back-calculation process (Table 3).
As a result of the back-calculation process in the BAKFAA software, the smallest RMS values were obtained, respectively, 11% for the N (normal) direction segment 1 and 7% for the O (opposite) direction segment 1. Therefore, asphalt and granular modulus values are close to the seed modulus but quite far for the subgrade case. Also, the resulting RMS value ranges from 7% to 16%, which indicates that the back-calculation output is still not precise as it is outside the rule range of 1% to 2%. Hence, the modulus of the existing pavement used in the subsequent analysis is the default value of the pavements listed in the Indonesian Road Pavement Design Manual [19]. Then, all four segments will be merged into one.
4. MECHANISTIC ANALYSIS
KENPAVE software was utilized to perform the mechanistic analysis, with the input values derived from the initial step. The developed model is a flexible pavement with material considered linear elastic. This model uses variations of overlay thicknesses: 50 mm, 80 mm, 100 mm, 130 mm, 150 mm, and 180 mm. With the single-axle dual-wheel scheme, the axle load of 80 kN is distributed over the four wheels so that each wheel receives a load of 20 kN. Another parameter determined in the model is a tire pressure of 750 kPa with a contact radius of 92.1 mm for each wheel, with a 165 mm distance between wheels and a 1,800 mm axle length. The critical point on the Y-axis is located directly beneath the load, in the middle of the two wheels (with a distance of 165/2 mm), and half of the center between the wheels (165/4 mm). On the Z-axis, the critical points are: at depth 0, the midpoint of each layer, the bottom of the asphalt layer, and the top of the subgrade layer. Table 4 shows the output strain from KENPAVE software for the implementation of the MEPDG damage model calculation.
| The Input of the MEPDG (2015) | |||||||
|---|---|---|---|---|---|---|---|
| Overlay | Permanent Deformation | Fatigue Cracking | |||||
| Asphalt 1 | Asphalt 2 | Granular | Subgrade | Aligator | Longitudinal | ||
| 50 mm | 4.4E-04 | 4.0E-04 | 3.5E-04 | 4.5E-04 | 2.9E-04 | 3.7E-04 | |
| 80 mm | 4.3E-04 | 3.3E-04 | 3.1E-04 | 3.9E-04 | 3.1E-04 | 2.8E-04 | |
| 100 mm | 4.2E-04 | 2.9E-04 | 2.8E-04 | 3.6E-04 | 2.9E-04 | 2.6E-04 | |
| 130 mm | 4.1E-04 | 2.5E-04 | 2.5E-04 | 3.2E-04 | 2.5E-04 | 2.3E-04 | |
| 150 mm | 4.0E-04 | 2.2E-04 | 2.3E-04 | 2.9E-04 | 2.2E-04 | 2.1E-04 | |
| 180 mm | 3.8E-04 | 1.9E-04 | 2.0E-04 | 2.6E-04 | 1.8E-04 | 2.0E-04 | |
|
Overlay Thickness (mm) |
Asphalt Deformation | Total Deformation | Longitudinal Crack | Aligator Crack | IRI |
|---|---|---|---|---|---|
| (mm) | (mm) | (m/km) | (%) | (m/km) | |
| 50 | 7.112 | 8.636 | 1748.773 | 92.2 | 3.409 |
| 80 | 7.874 | 9.398 | 1142.067 | 97.7 | 3.390 |
| 100 | 6.350 | 7.874 | 880.987 | 92.1 | 3.374 |
| 130 | 4.064 | 5.334 | 557.766 | 39.0 | 3.270 |
| 150 | 2.794 | 4.064 | 410.986 | 6.7 | 3.209 |
| 180 | 1.524 | 2.540 | 268.789 | 0.3 | 3.193 |
| Damage | Value | Units |
|---|---|---|
| Terminal IRI | 3.16 | m/km |
| Permanent deformation - total pavement | 19.05 | mm |
| AC thermal cracking | 132.58 | m/km |
| AC bottom-up fatigue cracking | 20 | % |
| AC top-down fatigue cracking | 378.79 | ft/mi |
| Permanent deformation - AC only | 6.35 | mm |
5. DESIGN OF MEPDG METHOD
In the Mechanistic-Empirical Pavement Design Guide, the empirical damage model comprises five types: Rut Depth, Load-Related Cracking, Non-Load Related Cracking-Transverse Cracking, Reflection Cracking on Hot-Mix Asphalt (HMA) Overlay, and Surface Smoothness [20]. Nonetheless, in the case of Indonesia, the sort of Non-Load Related Cracking- Transverse Cracking damage, which is caused by a freezing temperature factor below 0°C, is not relevant. As a consequence, only four empirical damage models were considered in this study. Other inputs, if necessary, will be adopted from the Indonesian specifications (AASHTO 2015 [21]) or the American standard, which will be utilized if none are available. The damage model calculation referring to the 2015 MEPDG methodology produced the damage value of each model (Table 5), which was then adjusted to the performance criteria. Whereas Table 6 shows the performance criteria recommended for arterial roads with 90% reliability in the 2015 MEPDG method.
An overlay of 130 mm is needed when applying the 2015 MEPDG method in order to prevent permanent deformation of the asphalt layer by 0.25 inches. Thus, the maximum value of the performance criteria of 0.24 inches can be fulfilled. Besides, the fatigue and crack damage analysis resulted in an overlay thickness of 180 mm. While at 150 mm thick, the output was nearly similar to the load requirements. In general, the longitudinal crack damage of the 2015 MEPDG was more dominant than alligator cracking due to the overlay thickness.
However, the results of structural damage analysis using the MEPDG method, as represented by the International Roughness Index (IRI), which represents quantitative longitudinal surface-bump data of road surfaces [ 22 ], remain dubious due to the relatively low value produced over a ten-year period. This is due to the fact that Arizona’s local calibration factor only reaches 1.2281, which is very small compared to the global calibration used in America, which reaches 40.
6. DAMAGE MODEL
6.1. Permanent Deformation Model
In the 2015 MEPDG, permanent deformation is the sum of deformations in asphalt, unbound base, and soil subgrade. This indicates that all layers of the pavement are reviewed. Therefore, executing the permanent deformation damage model using the 2015 MEPDG in Indonesia has good potential, considering many issues on the permanent deformation of the asphalt surface that cannot be controlled. At present, the only pavement evaluation methods accessible in Indonesia are those that detect permanent deformations in the subgrade layer.
The permanent deformation of asphalt in the 2015 MEPDG has a composition where the strain is inversely proportional to the load repetitions, which were calculated by dividing the permanent deformation value by the allowable strain. Moreover, there are supplementary variables in the form of correction of layer thickness and asphalt temperature, which also global and local calibration of load repetitions, layer thickness, and temperature. Otherwise, in the empirical model of permanent soil deformation, the number of load repetitions on the 2015 MEPDG is an exponential function, influenced by the material properties indicators: β and ρ. Furthermore, there are additional variables in the form of correction of layer thickness and material properties, as well as global and local calibration of thickness, depending on the type of material, i.e., granular layer or subgrade.
6.2. Fatigue Cracking Model
The MEPDG categorizes fatigue cracking into alligator, longitudinal, and reflective cracks [23]. The strain and modulus are inversely proportional to the number of load repetitions; contrarily, the asphalt content is directly proportional. This method also has additional variables, including layer thickness correction, damage type (alligator or longitudinal), air void percentage, and global or local calibration of layer thickness, resulting strain, and modulus. However, the reflection cracking model has not yet been globally calibrated by the 2015 MEPDG. In contrast, the most widely used damage percentage model is calculated by dividing 100% of the predicted damage by the design life (t) and the asphalt overlay thickness (a, b), with the addition of calibration parameters (c, d). In the Indonesian case, the road pavement design procedure considers only alligator cracking; therefore, the 2015 MEPDG damage model is more comprehensive to be applied.
6.3. IRI Model
The International Roughness Index (IRI) model, presently being developed in Indonesia, was created by William D.O. Paterson in 1987 according to the Highway Development and Management (HDM) III, as seen in Equation (1). The model has variables in the form of initial IRI, Structural Number (SN), cumulative ESA4, and pavement life. The SN value represents the strength of a pavement structure required for a combination of soil bearing capacity (Mr), cumulative load (ESAL), the Present Serviceability Index (PSI), and the environment. In addition, the SN value used in the AASHTO (1993) [ 24 ] method to determine the pavement layer thickness was based on the layer and drainage coefficients.
 |
(1) |
With:
RI ( t ): IRI value at time t (m/km)
RI 0 : initial IRI value (m/km)
SNC : structural number
NE 4 ( t ): cumulative ESA4 at time t (million ESA4)
t : pavement age (year)
Comparing the IRI models of the 2015 MEPDG with the Paterson model reveals that the initial IRI value was derived from the new pavement or new overlay. This value is then corrected to the MEDPG damage model and cumulative load or the structural number for the Paterson model. Regarding pavement life, the 2015 MEPDG expressed it as a safety factor (SF). In the Paterson model (1987) [25], however, pavement life is represented by an exponential function. Additionally, the variables employed are more diversified, especially concerning environmental aspects.
7. IMPLEMENTATION IN THE INDONESIAN CASE
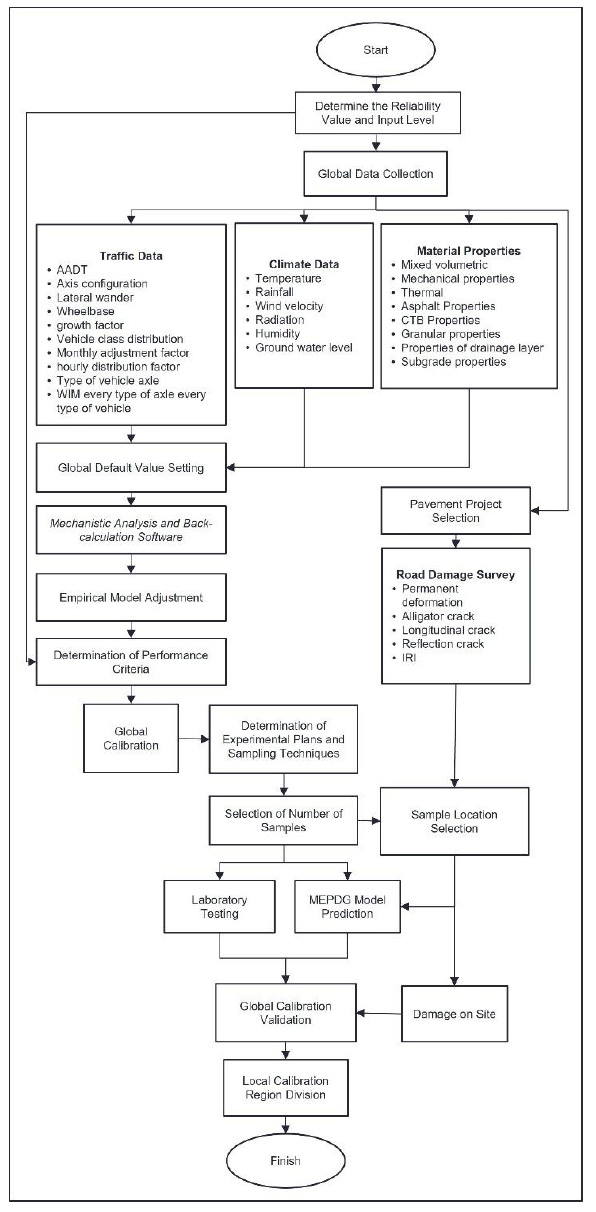
The adaptation of the 2015 MEPDG to the Indonesian settings presently still requires further exploration. Consequently, thorough traffic data and material properties data are mandatory to support the utilization of this method. Similarly, the global and local calibration models need vast data to generate a damage model suitable for national conditions. A flowchart of the process of implementing the 2015 MEPDG method in Indonesia is described in Fig. (2).
7.1. Data Requirements
The most crucial traffic data in this research is the WIM (Weight-in-Motion) data per axle type for each vehicle in Indonesia, which was adapted from the “Supplement to Road Pavement Design Manual” issued by the Indonesia Ministry of Public Works and Housing (2020) [26]. Likewise, the proportion of heavy vehicles belonging to each class within a certain period is also mandatory to identify its distribution. In the 2015 MEPDG, traffic data input is divided into three distinct levels depending on the completeness of the data possessed, as described in the Methodology section. This manual covers default values related to WIM data, heavy vehicle distribution, and axle types for each kind of vehicle. These indicators are also entered when using the AASHTOWare software, which incorporates both fatigue and thermal cracking [27]. Moreover, to adapt the MEPDG procedure to Indonesia, it is necessary to discover the default value of traffic data, as listed in Fig. (2).
In Indonesia, pavement material properties have been regulated in the General Specifications (2018) [28] issued by the Directorate of Highways, Ministry of Public Works and Housing. However, several essential parameters in applying the MEPDG method have not been defined yet but need to be determined. Hence, the standard for asphalt material properties must be evolved, especially the Dynamic Modulus values of the asphalt layer at different loading times and temperature periods. The material properties of the asphalt layer in the 2015 MEPDG are classified into several matters, including volumetric data, and mechanical and thermal properties. In contrast, the granular and subgrade layers are divided into strength or modulus, along with the thermal, gradation, and engineering properties. The Federal Highway Administration (FHWA) database, which includes hourly climate details from year to year for each weather station, is utilized for implementing the MEPDG method. Not only does it contain complete data, but it is also easy to access. However, in the case of Indonesia, climate data must be collected from the National Meteorology, Climatology, and Geophysics Agency. Unfortunately, the information available is merely in the form of daily climate and rainfall, while the comprehensive data on groundwater levels for Indonesia has not yet been known.
7.2. Damage Model Adjustment
To be applied in Indonesia, the empirical model and performance criteria of the 2015 MEPDG should be adapted to local circumstances. Hence, the first step is to modify the input of the empirical model in order to match the units used in Indonesia before calibrating the formulas and adjusting the pavement damage that exists in the area under review. Furthermore, as winter does not occur in Indonesia, the variables related to freezing temperature were omitted. Some formulas are described as follows:
- Asphalt permanent deformation model:
 |
(2) |
With:
∆p(HMA): permanent deformation on HMA layer (mm)
Ɛr(HMA): resilient or elastic strain at the center of HMA
n: number of load repetitions
T: pavement temperature (°C)
kz: depth correction, which is formulated as follows:
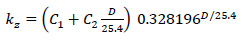 |
(3) |
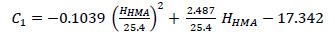 |
(4) |
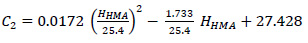 |
(5) |
With:
D: depth below the surface (mm)
HHMA: total HMA thickness (mm)
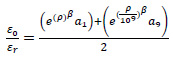
- Soil Permanent Deformation Model:
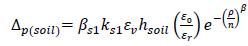 |
(6) |
With:
∆p(soil): permanent deformation of the soil layer (mm)
n: number of load repetitions
ε0: the intercept of permanent deformation repetitive load
tests in the laboratory (in/in)
εr: resilient strain of the laboratory test to determine properties ε0, β, ρ (in/in)
εv: average vertical strain in the layer
hsoil: soil layer thickness (mm)
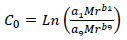
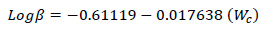 |
(7) |
 |
(8) |
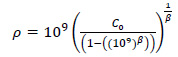
 |
(9) |
 |
(10) |
With:
Wc: water content (%)
Mr: resilient modulus (psi)
a1,9: regression constraints: a1 = 0.15 dan a9 = 20.0
b1,9: regression constraints: b1 = 0.0 dan b9 = 0.0
- Fatigue cracking model:
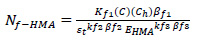 |
(11) |
with:
Nf-HMA: a number of load repetitions
εt: tensile strain at a critical location
EHMA: dynamic modulus HMA (psi)
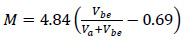
Where:
 |
(12) |
 |
(13) |
with:
Vbe: effective asphalt content by volume (%)
Va: air void percentage in the HMA mixture (%)
Ch: thickness correction (depending on the crack type)
- CH of Alligator Cracking:
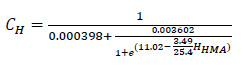 |
(14) |
- CH of Longitudinal Cracking:
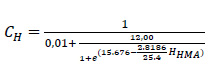 |
(15) |
With:
HHMA: a total of HMA thickness (mm)
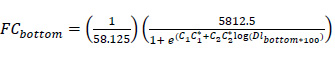
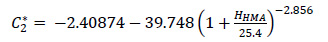
- Alligator Cracking Area:
 |
(16) |
 |
(17) |
 |
(18) |
With:
FCbottom: alligator crack area at the bottom of HMA (%)
Dlbottom: cumulative damage index at the bottom of HMA
- Longitudinal Cracking Area:
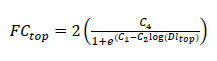 |
(19) |
with:
FCtop: the length of the longitudinal crack at the top of HMA (m/km)
Dltop: cumulative damage index at the top of HMA
The alligator cracking width in the MEPDG model is 12 ft (3.67 m) with a length of 500 ft (152.40 m). When applied to Indonesia, the area's dimension refer to the national road standards, which is 3.6 m (11,81 ft) wide and 150 m (492.13 ft) long. This measure results in a total area of 5,812.5 ft2. On the other side, the length of the longitudinal cracking considered in the MEPDG is 500 ft (152.40 m). Thus, the size reviewed for the Indonesian case can be converted to 150 m (492.13 ft) long.
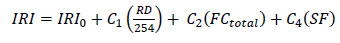
- The IRI model:
 |
(20) |
with:
IRI0: IRI after overlay (m/km)
SF: site factor
FCtotal: fatigue cracking area (alligator, longitudinal, reflection) (%)
RD: average rut depth (mm)
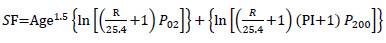 |
(21) |
with:
Age: pavement life (year)
PI: soil index plastic percentage
R: average annual rainfall (mm)
P02: percent passing 0.02 mm
P200: percent passing 0.075 mm
7.3. Definition of Performance Criteria
The arrangement of performance criteria aims to guarantee that the constructed road is able to serve the traffic loads during its design life while still preserving the comfort of road users and road functionality. The design performance criteria for Indonesian conditions were determined following the regulation of the Directorate of Highways concerning “Guidelines for Selection of Preventive Maintenance Technology for Road Pavement” [29] for road damage models, as well as rules by Indonesia's Ministry of Public Works and Housing on “Road Maintenance and Surveillance Procedures” [30] for the IRI model. Moreover, more studies are demanded since the determination of the first IRI value is contingent on the contractor's ability to work on the road surface layer.
7.4. Local and Global Calibration
In this instance, global calibration findings from the National Cooperative Highway Research Program (NCHRP) in 2004 [31] may be used in conjunction with initial calibration values derived from the most recent American global calibration. As for local calibration, it may be adopted from one of the states in America, such as Arizona, or by following the instructions in the “Guide for the Local Calibration of the Mechanistic-Empirical Pavement Design Guide”, which is released by AASHTO [32, 33].
8. RESULTS AND DISCUSSION
As a whole, the implementation of the 2015 MEPDG method in Indonesia still needs much more research, testing, and surveys, as well as many suitable kinds of equipment. Consequently, the budget will be affected. The simplification of the MEPDG method can be done by simplifying the mechanistic analysis process, which requires traffic, climate and various material properties. Although these data support the level of accuracy of the MEPDG method, but in order to produce output in the form of a specific level of damage which is, of course, very useful in road maintenance in Indonesia, simplification must be used. Modeling the material as linear elastic is one way to simplify the mechanistic analysis process. Although the reliability of the output will be reduced, this strategy may lower the number of input variables on the material properties. It is also possible to minimize the diversity of traffic data and the level of detail in the daily climatic data as a kind of simplification. Finally, the accuracy of the results may be enhanced by calibrating the original empirical model to Indonesian settings.
Overall, the procedure of Arizona calibration is applicable as the foundation for the execution of this method in Indonesia, which indicates that the general methodology of MEPDG may be developed in Indonesia by calibrating the original Arizona model to specific regions in Indonesia.
CONCLUSION
The results of the calculation of overlay thickness using the damage model in the 2015 MEPDG Arizona calibration resulted in an overlay thickness of 180 mm, which has a control limit of 268.789 m/km performance criteria for longitudinal cracks. The same thickness is also obtained when using the method from Indonesia (Pavement Design Manual 2017). From this, it means that the Arizona calibration can be used as the basis for the use of the MEPDG method in Indonesia. Analysis of the functional condition of the road from the calculation of the IRI value method MEPDG 2015 Arizona calibration is still questionable because it produces small damage at the end of the design life. This is because the value of the calibration factor used by Arizona is quite small in IRI models, such as at the proper rut depth calibration factor 1.2281, while at global calibration used a value of 40.
The findings of this article can be used to guide further research and exploration of MEPDG implementation in Indonesia. The calibration of the empirical model with the Arizona calibration values, which is the basis for application to road projects in Indonesia, is essentially the starting point for this strategy. Therefore, to produce a procedure with a high level of reliability, a more extensive analysis of the variables is required, as well as a more robust and diversified data set, both in terms of material properties, traffic and axle loads, as well as climate data. However, it can also be done simplification of the method, which in this research is made in a flow chart for implementation in Indonesia.
The future direction of this research topic would be to calibrate and validate the model against the local parameters to improve the accuracy of the pavement predictions. Additionally, a sensitivity analysis should also be performed to identify the MEPDG design inputs for flexible pavements. In the end, the outcomes of the pavement design using the 2015 MEPDG can be compared to the 2017 Road Pavement Design Manual, which has so far been applied in Indonesia. Moreover, the outputs of the empirical model resulting from the 2015 MEPDG will be more comprehensive when compared and assessed to some road damage data on the existing pavement in Indonesia.
LIST OF ABBREVIATIONS
| MEPDG | = Mechanistic-Empirical Pavement Design Guide |
| RMS | = Root Mean Square |
| HMA | = Hot-Mix Asphalt |
| IRI | = International Roughness Index |
| WIM | = Weight-in-Motion |
CONSENT FOR PUBLICATION
Not applicable.
AVAILABILITY OF DATA AND MATERIALS
The data associated with this paper are available within the article.
FUNDING
None.
CONFLICT OF INTEREST
The authors declare no conflict of interest, financial or otherwise.
ACKNOWLEDGEMENTS
Declared none.

