All published articles of this journal are available on ScienceDirect.

Seismic Hazard Maps of Bengkulu City, Indonesia, Considering Probabilistic Spectral Response for Medium and Stiff Soils
Abstract
Background:
This paper presents the extended work of a seismic hazard map for Bengkulu City, Indonesia. In this current study, seismic hazard maps are generated by considering site variations in Bengkulu City, Indonesia.
Methods:
First, site investigation data is collected. Furthermore, the probabilistic spectral response for Bengkulu City is analysed. The spectral matching method is implemented to obtain appropriate ground motion considering the most dominant earthquake scenario that occurred. A seismic ground response analysis is conducted to obtain several ground motion parameters, such as peak ground acceleration, spectral acceleration values at 0.2 s and 1 s, and ground motion amplification.
Results:
The results show that peak ground acceleration in the study area is generally within the range of 0.5 to 0.6g. It indicates that most sites in Bengkulu city could undergo strong motion. Spectral accelerations at 0.2 s and 1 s are also dominantly found in the range of 0.9 to 1.2g and the range of 0.5 to 0.7g. Generally, ground motion in the study area could amplify up to 1.1 to 1.5.
Conclusion:
Spectral acceleration curve for site classes in Bengkulu City shows a similar trend to other spectral accelerations. It indicates that the spectral acceleration proposed in this study could be implemented in the study area.
1. INTRODUCTION
Bengkulu City, the capital city of Bengkulu Province,, is locatedon the western coastline of Sumatra Island. This area is known as one of the vulnerable areas on the west- coastline of Bengkulu City that is very vulnerable to earthquakes [1]. Within the last two decades, at least two large earthquakes with magnitudes more than Mw 7.0 had yielded massive destruction to the city [2]. Those earthquakes were known as the Mw 7.9 Bengkulu-Enggano Earthquake in 2000 and the Mw 8.6 Bengkulu-Mentawai Earthquake in 2007. Meanwhile, the building establishment in Bengkulu City has significantly raised. However, the urgency of the earthquake's impact on Bengkulu City and its impact on Bengkulu City and its implementation on the structural building is still not understood [3].
In Indonesia, seismic resistance design should be prioritised before construction. In line with earthquake impact, seismic resistance design is generated based on two seismic hazard assessments that are known as deterministic seismic hazard assessment (DSHA) and probabilistic seismic hazard assessment (PSHA) [4]. In general, the use of seismic hazard assessment considers the earthquake event in a region to determine the most credible earthquake that could be a basis for the seismic resistance design. Reiter [5] mentioned that the use of DSHA is to determine the most significant earthquake that had occurred in the region. The most significant earthquake is measured from the damage intensity level that could be resulted. McGuire [6] explained the evaluation of annual frequencies of exceedance of ground motion levels (typically designated by peak ground acceleration or spectral accelerations) at a site. The typical result of seismic hazard is the uniform spectral acceleration curve that comes as the basis for determining seismic design. In Indonesia, every building should be designed considering spectral acceleration from seismic hazard assessment. The Indonesia's seismic design code, SNI 1726:2019 [7], is Indonesia's most updated seismic design code. This seismic design code is developed by PHSA. For Bengkulu City, several studies on local seismic design codes have been presented by several researchers. Mase [8] conducted a seismic hazard assessment in Bengkulu City based on DSHA in which the most credible earthquake considered was the Mw 8.6 Bengkulu-Mentawai Earthquake in 2007. Mase [9] presented local seismic hazard maps considering stiff soil (Site Class D) and very dense soil (Site Class C) response spectra in Bengkulu City, Indonesia. In general, the results of those previous studies confirmed that spectral acceleration design derived based on seismic hazard map is applicable for seismic resistance design. However, seismic hazard maps based on a probabilistic approach have still not yet been presented in those recent studies.
The use of seismic hazard maps is very important. Seismic hazard maps can be used for seismic resistance design and the calculation of seismic loss estimation. Several researchers had reported the implementation of seismic hazard maps. Crowley and Bommer [10] mentioned that earthquake loss modeling has gradually grown. Implementing seismic hazards to predict earthquake loss could help the understanding of earthquake effects in construction sectors. Crowley and Bommer [10] also suggested that the role of insurance industries is also important. Yeh et al. [11] explained that seismic hazards and loss estimation can also capable of assisting to simulatein simulating earthquake scenarios and estimating the initial prediction of potential loss during the earthquake. In line with the benefit of seismic hazard maps in predicting the potential loss; therefore, seismic hazard analysis is carefully considered [12].
This paper discusses seismic hazard maps of Bengkulu City, Indonesia, considering probabilistic spectral responses for medium and stiff soil sites. First, site investigation data were collected from previous studies conducted on studies of Mase [8, 9]. The probabilistic spectral acceleration considering two dominant sites in Bengkulu City [2] is derived based on the seismic design code of SNI 1726:2019 [7]. A spectral matching method is implemented to generate spectral acceleration in the study area. Non-linear seismic ground response analysis [13, 14] is conducted to obtain several ground motion parameters. Those ground motion parameters include peak ground acceleration (PGA), spectral accelerations at 0.2 s and 1 s (SA at 0.2 s and SA at 1 s), and amplification factors collected to compose seismic hazard maps. As an area with high-seismic activity, Bengkulu City is still focusing on the application of seismic hazard assessment for structural design. Therefore, this study is conducted to complete seismic hazard assessment studies that are already presented in previous studies. Implementing a seismic hazard map to generate spectral design acceleration is presented and compared to previous studies. In general, the results of this study could describe the importance of seismic hazard maps in supporting the understanding of seismic resistance design in Bengkulu City, Indonesia.
2. MATERIALS AND METHODS
2.1. Seismotectonic Setting and Geological Condition
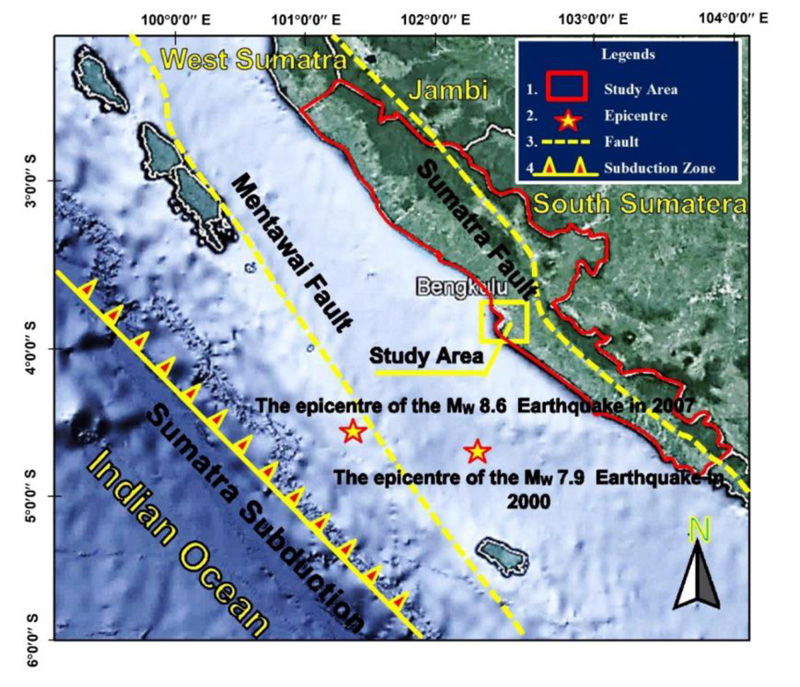
Fig. (1) shows the seismotectonic setting of Bengkulu. From Fig. (1), it can be seen that Bengkulu City is indicated by yellow rectangular. Several active tectonic sources could trigger an earthquake in Bengkulu City and its surrounding areas. The first source,, Sumatra Subduction, is the primary earthquake source [15]. This source triggered many earthquake events in Bengkulu City, including the Mw 8.6 Bengkulu-Mentawai earthquake in 2007 and the Mw 7.9 Bengkulu-Enggano earthquake in 2000 [16]. There are also two active tectonic faults called Sumatra and Mentawai Faults. Sumatra Fault is positioned in the Sumatra Island that splits Sumatra Island to be two parts separated by Bukit Barisan Mountainous [17, 18]. For Mentawai Fault is located between Sumatra Island and Subduction Zone [19]. The Mentawai fault zone is formed due to the growth of the thrust fault, which moves forward towards the arc so that the youngest structure is formed in the eastern part [20]. Mase [8] mentioned that the impact of an earthquake triggered by the Mentawai Fault could be more serious since this earthquake source is located in the Indian Ocean. In other words, the mega-tsunami in Sumatra can happen again if a large earthquake occurs [21].
Fig. (2) presents the geological map of Bengkulu City. As presented by many researchers such as Mase et al. [2], Mase [8], Mase [9], Mase et al. [22], Farid and Mase [23], and Mase et al. [24], there are various geological compositions in Bengkulu City. The most dominant geological composition in Bengkulu city is alluvium terraces (Qat). This formation is generally found in more than half area of Bengkulu City, especially those located in the western side of Bengkulu City. This formation is composed of sand, silt, clay, and gravel. Other formations, such as bintunan formation (Qtb), alluvium (Qa), reef limestone (QI), swamp deposit (Qs), and andesite (Tpan). Those geological formations are generally also composed of several sedimented rocks, reef rocks, and sedimented materials, such as clay, silt, and sand. Basically, there are two dominant site classes in Bengkulu City, i.e., Site Class C, and Site Class D. According to a study conducted by Mase [2], sites located in Qat are dominantly classified as Site Class D, with the value of time-averaged of shear wave velocity for first 30 m depth (Vs30) is about 180 to 360 m/s. The areas located in the eastern part of Bengkulu City with geological formations beside Qat are generally dominated by Site Class D, which has Vs30 of about 360 to 760 m/s.
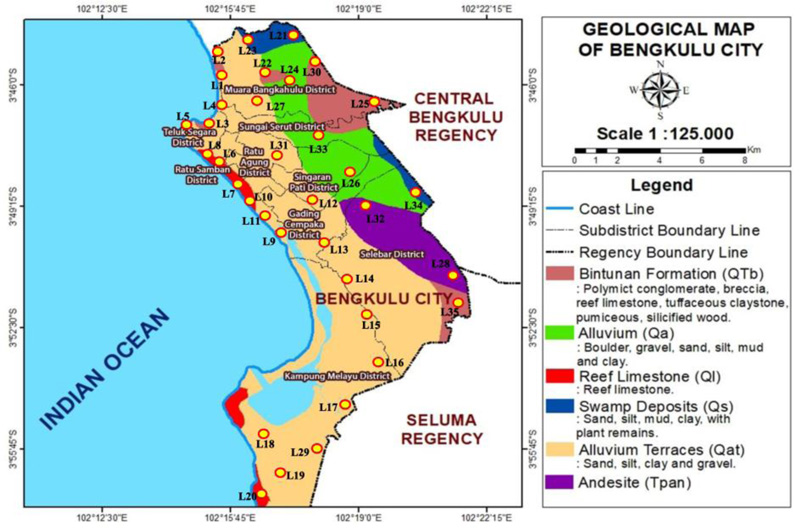
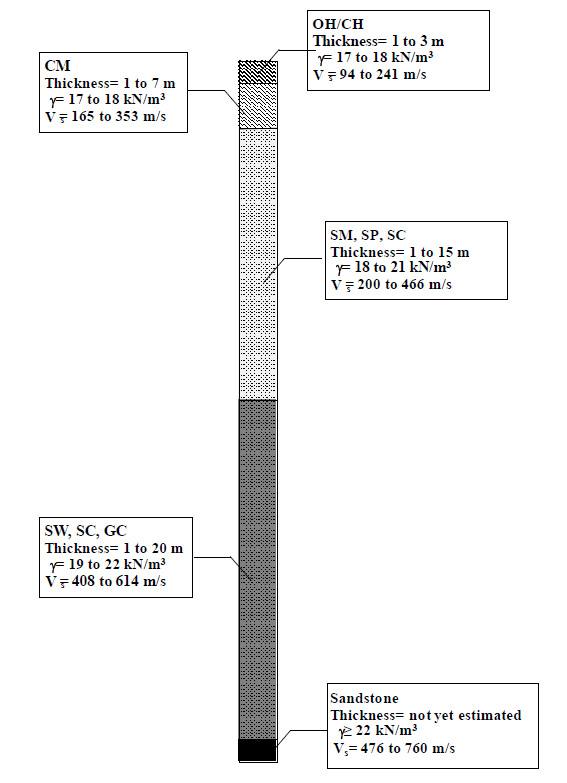
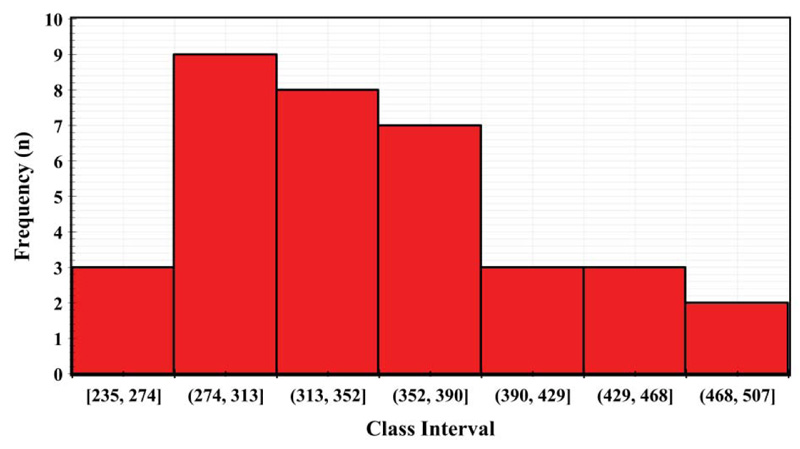
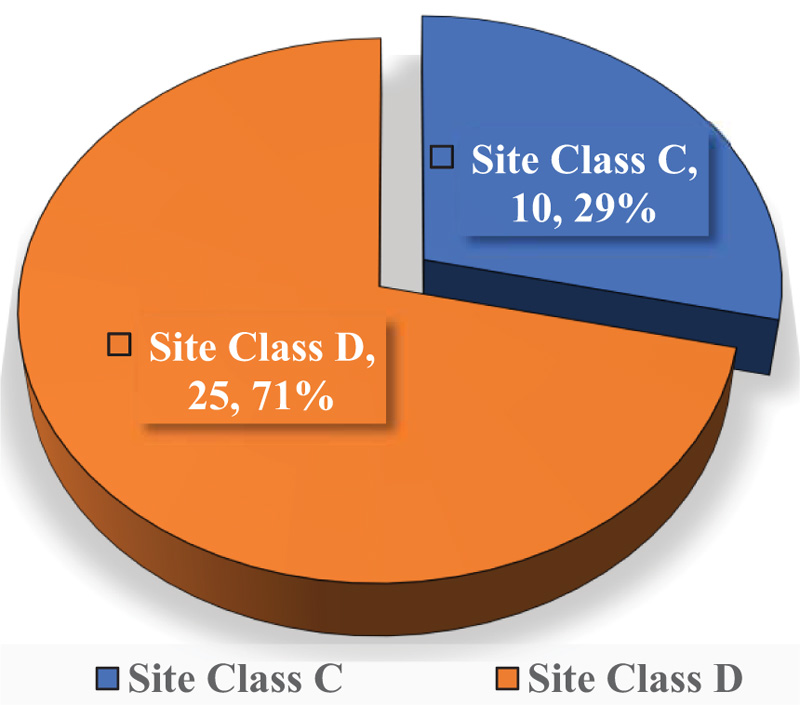
In line with the variations of geological and local site conditions, site investigation data is collected from previous studies by Mase et al. [2], Mase [8, 9]. In Fig. (2), the site investigation points are indicated by yellow-red circles, namely L1 to L35. Several site investigations are conducted at those points, including boring-long, and shear wave velocity measurements. Mase et al. [2], Mase [9] summarised the typical sub-soils in Bengkulu City as presented in Fig. (3). As presented in Fig. (3), there are five main layers as typically composed layers in Bengkulu City. The first layer is known as the clay layer, dominated by organic clay and high-plasticity clay (OH-CH); the thickness of the layer is about 1 to 3 m with Vs of about 94 to 241 m/s. This layer is followed by silty clay (CM) with a thickness of about 1 to 7 m and Vs of 165 to 353 m/s. The third layer is dominated by mixed sandy soils classified as silty sand (SM), poor-graded sand (SP), and clayey sand (SM). This sand layer has a thickness of 1 to 15 m and Vs of 466 m/s. Dense sand layers dominated by well-graded sand (SW), clayey sand (SC), and clayey gravel (GC) are noted as the fourth typical layer in Bengkulu City. This layer has a thickness of 1 to 20 m with Vs of 408 to 614 m/s. At the bottom, a rock layer categorised as sandstone is generally found. This layer has Vs of 476 to 760 m/s and it is recorded as an engineering bedrock surface in Bengkulu City. Several studies conducted by Mase [4] and Mase [9] mentioned that the depth of engineering bedrock in Bengkulu City generally varies from 30 to 50 m depth below the ground surface. Fig. (4) shows the time-averaged shear wave velocity for the study area's first 30 m (Vs30). It can be observed there are seven classes of Vs30 in the study area. The minimum Vs30 in the study area is 235 m/s, and the maximum one is 507 m/s. Fig. (4) also shows that Vs of 274 to 313 m/s is dominant in the study area. Based on the Vs30 distribution, Fig. (5) shows the distribution of Site Classification in the study area. Fig. (5) shows that most sites are categorised as Site Class D according to National Earthquake Hazard Reduction Program [25]. Site Class D is assigned for sites with Vs30 of 180 to 360 m/s, whereas Site Class C is assigned for sites with Vs30 of 360 to 760 m/s.
2.2. Hazard Assessment Seismic Ground Response Analysis
Several hazard assessment methods have been presented by several researchers in Bengkulu City. For example, Mase [8] implemented deterministic seismic hazard analysis to depict seismic hazard assessment in Bengkulu City. In Mase [8], the most credible earthquake is determined based on the potential damage intensity level resulting from an earthquake. Therefore, the assessment of hazard potential is important in the DSHA procedure before selecting the most credible earthquake for design consideration. Mase [9] presented seismic hazard maps considering the local site condition of the study area. In this current study, Mase [9] used a spectral acceleration design for local sites in Bengkulu City. Spectral acceleration designs for Bengkulu City are obtained from a study conducted by Mase and Somantri [26]. The spectral matching method is implemented to generate ground motion for Bengkulu City. Meanwhile, the spectral acceleration design under the probabilistic approach released by the Government of Indonesia [7] is still not yet used to determine hazard assessment for Bengkulu City. For all approaches of seismic hazard analysis, i.e., DSHA, PSHA, and local design, one-dimensional seismic ground response analysis is used to perform seismic wave propagation for collecting ground motion parameters for seismic hazard mapping.
A method to generate ground motion that uses spectral acceleration is known as the spectral matching method [27, 28]. This method has been successfully implemented to generate ground motion for several strong shaking events, as reported by Mase et al. [29] and Mase [15]. The method could be implemented to predict ground motion for a site with no ground motion record. The spectral matching method uses a target spectrum as the matched parameters for spectral ground motion. From the matched spectra, the artificial accelerogram can be generated. The artificial accelerogram relevant to the target spectrum is determined by adjusting its frequency content based on the Fourier Transform [30]. The design of the synthetic accelerogram was initiated by defining the Gaussian White Noise, which was then multiplied by the envelope shape, as recommended by Saragoni and Hart [31]. Combination of procedures in obtaining an accelerogram that follows the recommended envelope shape, so that the resulting accelerograms tend to be similar to real accelerograms. This study implements the spectral matching method to determine the input accelerogram for ground response analysis.
Several researchers had presented several models for seismic ground response analysis. The first generation of the soil model was equivalent linear, proposed by Schnabel et al. [32]. Since there are some limitations on the equivalent linear method, a new method called the non-linear method was proposed. Several approaches to model, the non-linear behaviour of soil, were the strain space plasticity model [33], piece-wise element model [34], multiyields surface model [35], and pressure-dependent hyperbolic model [10, 11]. A study conducted by Misliniyati et al. [36] showed that the non-linear model tends to result in the appropriate results to ground motion records. Misliniyati et al. [36] also revealed that pressure dependent hyperbolic model could be the alternative to predict a better seismic ground response analysis result, especially related to ground motion parameters. Therefore, in this study pressure dependent hyperbolic model is implemented as the soil parameter for seismic ground response analysis. Pressure dependent hyperbolic model emphasizes on generated hysteresis loop during cyclic loading. The model has a backbone curve defined as the hyperbolic function to determine the reliable hyperbolic curve. This model was originally proposed by Hashash and Park [37, 38] based on Matasovic [39]. The dynamic material properties are determined in the analysis based on previous studies. For cohesionless material, modulus and damping are defined by Seed and Idriss [40], whereas Vucetic and Dobry [41] recommendations are employed for cohesion material. The recommendation on dynamic properties suggested by Menq [42] is used for coarse material. Pressure dependent hyperbolic model is now implemented in a computer program called DEEP SOIL.
The calculation method implemented in DEEPSOIL itself for seismic ground response analysis is a lumped-mass system [42-44]. Lumped-mass system assumes that every soil layer as a material mass that has parameters of shear modulus (G), soil density (ρ), soil mass (m), soil thickness (h), and shear wave velocity (Vs). In the simulation, the structure of the lumped-mass system is performed by non-linear analysis by time increment [45]. At the bottom of system, a seismic wave that represents the actual motion is applied. In this study, there are two motions applied, i.e., motion for Site Class C and motion for Site Class D. The reference on how to define site class is based on a study conducted by Mase et al. [2] in which Bengkulu City is separated into two site classes, i.e., Site Class D in the western part and Site Class C in the eastern part. From seismic ground response analysis, several parameters, such as peak ground acceleration at the surface (PGA), Spectral Acceleration (SA) at 0.2 s and 1 s, and ground motion amplification factor (AF) are also collected.
2.3. Research Framework
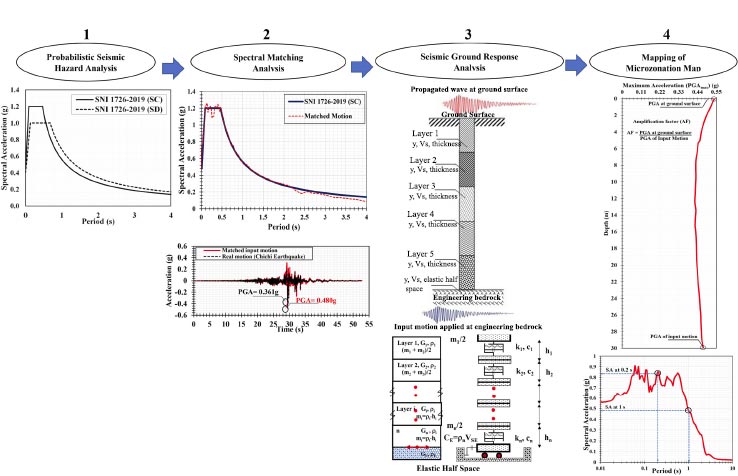
Fig. (6) presents the research framework of this study. There are four steps that are conducted to achieve the objective of this study. The first step is probabilistic seismic hazard analysis, the second step is spectral matching analysis, the third step is one-dimensional seismic ground response analysis, and the last step is seismic micro-zonation mapping. First of all, the data had been collected from previous studies. In this research, two relevant studies conducted by Mase [8, 9] are referred. In those studies, site investigation data, geological maps, and seismotectonic information are collected. The main goal of this study is to compose a seismic microzonation map considering probabilistic seismic hazard analysis in which the Government of Indonesia had released the results through SNI 1726:2019 [7].
The step of analysis is initiated by obtaining the spectral acceleration design (STEP 1) generated from probabilistic seismic hazard analysis in the seismic design code of SNI 1726:2019 [7]. Two spectral acceleration designs are collected considering site class in Bengkulu City, especially according to Mase et al. [2], who mentioned that Bengkulu City is divided into two major site classes, i.e., Site Class C and Site Class D.
The next step is to conduct a spectral matching analysis (STEP 2). The spectral acceleration design based on SNI 1726:2019 is used as target spectra in the analysis. This study uses the spectral matching method from Hancock et al. [27]. The matched spectral can be obtained from the analysis and transferred into waveform analysis considering the relevant ground motion in the study area. A study conducted by Mase [4] elaborated that the Chichi earthquake motion could be one of the relevant ground motions for Bengkulu City since the most common earthquake type in Bengkulu City is generally a subduction earthquake triggered by the activity of Sumatra subduction. Therefore, the synthetic ground motion derived from spectral matching analysis is generated from matched spectral acceleration and Chichi input motion.
Afterward, a one-dimensional seismic ground response analysis is conducted to simulate seismic wave propagation (STEP 3). The wave is applied to engineering bedrock and propagated up to the ground surface. According to Mase [4, 8] the position of engineering bedrock in Bengkulu City is generally found from 30 to 50 m depth. Therefore, for engineering practice, the engineering bedrock surface at 30 m is generally and commonly implemented in Bengkulu City [8, 15, 34]. Engineering bedrock surface is indicated by Vs of 760 m/s [46, 47]. In this research, software called DEEPSOIL from Hashash et al. [11] was used. Several ground motion parameters at the ground surface, such as peak ground acceleration (PGA), spectral acceleration at 0.2 s and spectral acceleration at 1.0 s, and amplification factor (AF), are collected.
The amplification factor is obtained from the comparison between maximum acceleration at the ground surface and maximum acceleration of input motion. Those ground motion parameters are then collected and interpreted into seismic micro-zonation maps (STEP 4). To observe the performance of seismic design yielded from probabilistic seismic hazard analysis, the comparison of spectral acceleration design is presented in this study. In general, the results of this study could provide information related to seismic resistance design for structural buildings in Bengkulu City.
3. RESULTS AND DISCUSSION
3.1. Spectral Matching Results
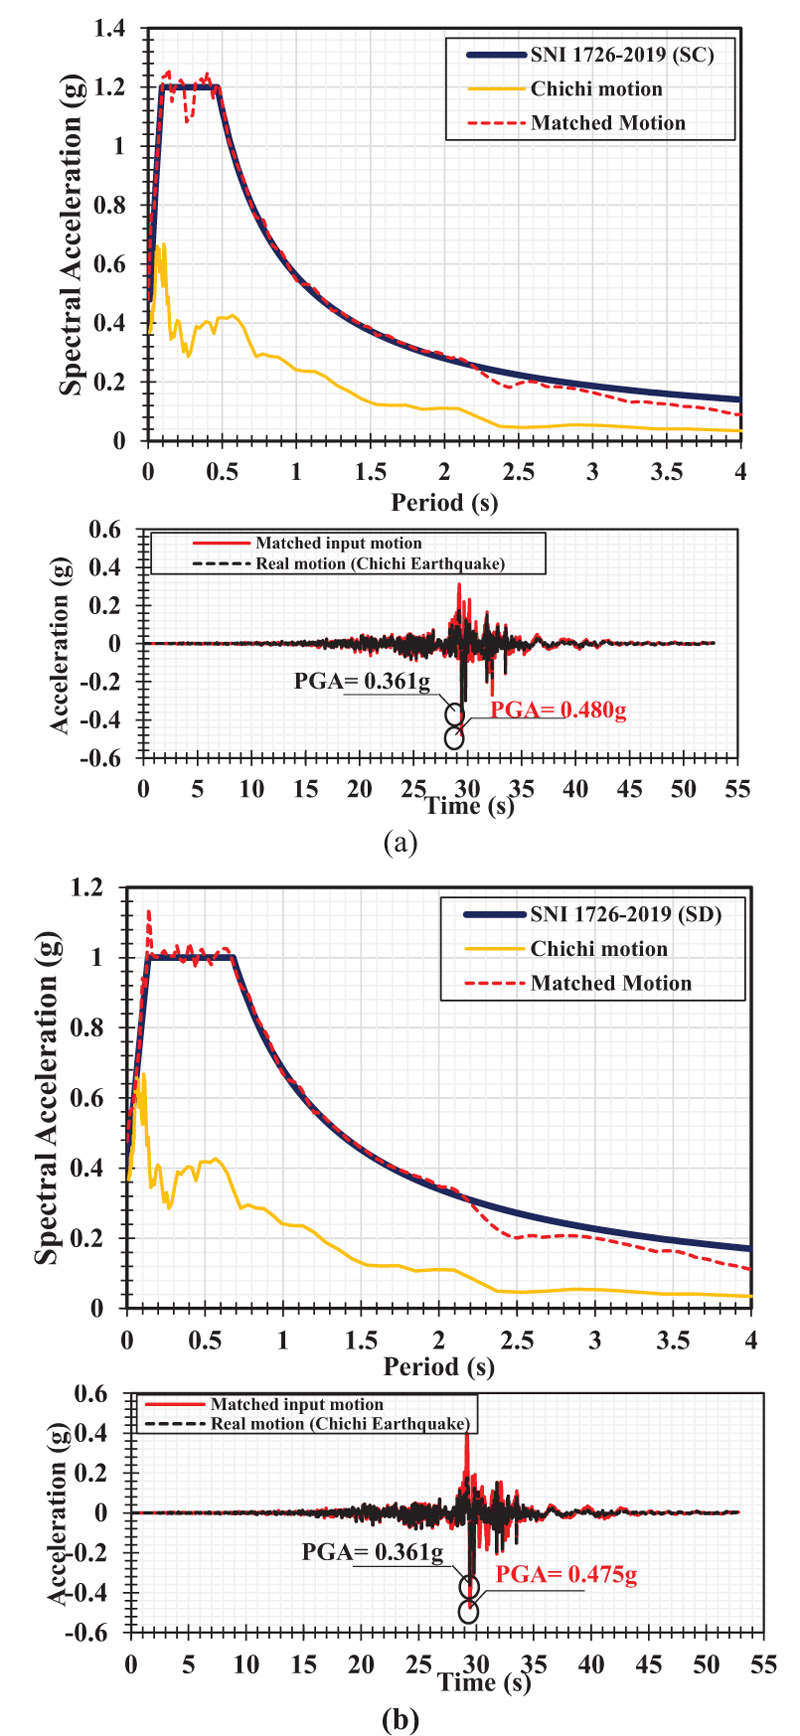
Fig. (7) presents the result of the analysis spectral matching result. Fig. (7a) is the spectral matching result for Site Class C and Fig. (7b) is the spectral matching result for Site Class D. As previously explained, Mase [4] mentioned that the Chichi earthquake motion which is triggered by subduction, could be a suitable motion for Bengkulu City. Bengkulu City itself is generally undergoing earthquakes under subduction scenarios. In Fig. (7), it can be observed that matched spectral acceleration is generally consistent with target spectral acceleration. The motions for both site classes are generated from the matched spectral acceleration. Those motions are then used as the input motions for one-dimensional seismic ground response analysis.
Table 1 presents a ground motion parameters comparison between original motion and matched accelerations from spectral matching for Site Class C and Site Class D. As presented in Table 1, it can be observed that PGA values for Site Class C and D are 0.480g and 0.475g, respectively. For Peak Ground Velocity (PGV), the values of matched motions are 51.719 and 62.213 cm/s, respectively. For Peak Ground Displacement (PGD), the values of matched motion are 28.339 and 34.590 cm, respectively. The ratios of Vmax/Amax are 0.108 and 0.131 s. In terms of duration, the significant durations for motions of Site Classes C and D are 10.330 and 7.080 s, respectively. The predominant periods for those motions are 0.100 and 0.180 s, respectively.
| S. No | Parameters | Acceleration | Unit | ||
|---|---|---|---|---|---|
| Original | Site Class C | Site Class D | |||
| 1 | Peak Ground Acceleration | 0.361 | 0.480 | 0.475 | g |
| 2 | Peak Ground Velocity | 21.548 | 51.719 | 62.213 | cm/s |
| 3 | Peak Ground Displacement | 21.883 | 28.339 | 34.590 | cm |
| 4 | Vmax/Amax | 0.061 | 0.108 | 0.131 | s |
| 5 | Acceleration Root Mean Square | 0.021 | 0.051 | 0.048 | g |
| 6 | Velocity Root Mean Square | 4.086 | 9.616 | 9.616 | cm/s |
| 7 | Displacement Root Mean Square | 6.468 | 8.719 | 8.719 | cm |
| 8 | Arias Intensity | 0.375 | 2.157 | 1.862 | Intensity |
| 9 | Characteristic Intensity | 0.023 | 0.085 | 0.076 | Intensity |
| 10 | Specific Energy Density | 881.190 | 4881.423 | 4881.423 | cm2/s |
| 11 | Cum. Absolute Velocity | 500.124 | 1146.852 | 995.483 | cm2/s |
| 12 | Acceleration Spectrum Intensity | 0.156 | 0.478 | 0.408 | g·sec |
| 13 | Velocity Spectrum Intensity | 80.729 | 206.457 | 239.287 | cm |
| 14 | Housner Intensity | 73.313 | 194.308 | 228.301 | cm |
| 15 | Sustained Maximum Acceleration | 0.190 | 0.427 | 0.389 | g |
| 16 | Sustained Maximum Velocity | 14.676 | 36.302 | 36.302 | cm/s |
| 17 | A95 parameter | 0.232 | 0.497 | 0.443 | g |
| 18 | Predominant Period | 0.060 | 0.100 | 0.180 | s |
| 19 | Significant Duration | 11.780 | 10.330 | 7.080 | s |
3.2. Ground Response
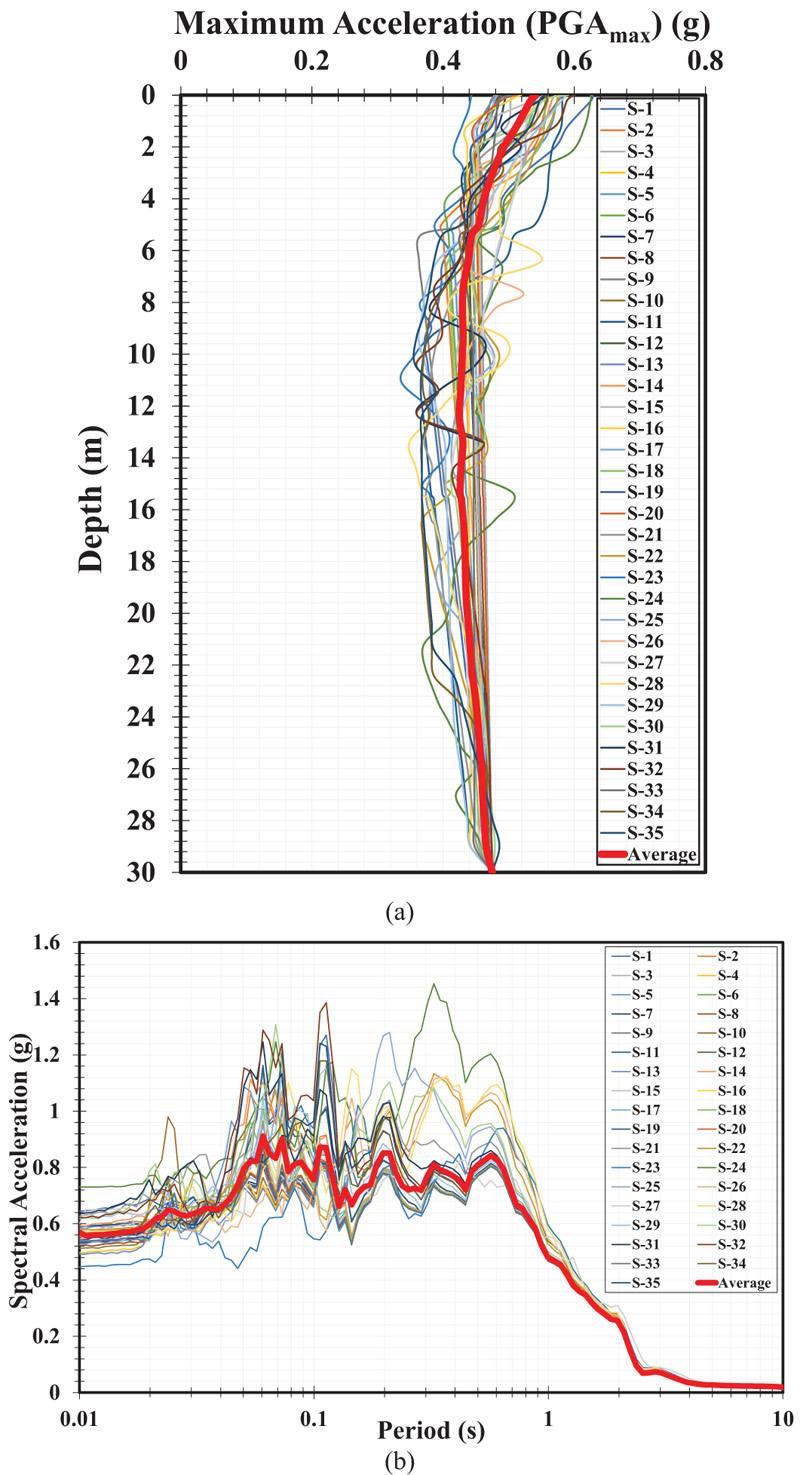
Fig. (8) presents the results of a one-dimensional seismic ground response analysis. Fig. (8a) presents the first 30 m depth acceleration profile at the investigated sites. As presented in Fig. (8a), it can be observed that applied ground motion tends to enlarge the ground surface. From the analysis, peak ground acceleration at the ground surface generally reaches the value of 0.54g. It indicates that ground motion tends to amplify up to 1.1 times at the ground surface. Fig. (8b) presents the spectral acceleration at the ground surface for all investigated sites. It can be observed at the period of 0.01 s, the spectral acceleration value reaches 0.56g. At a short period, i.e., a period of 0.2 s, the average spectral acceleration is about 0.84g. At a long period, i.e., a period of 1 s, the average spectral acceleration shows the value of 0.48g. From the results of the ground response, parameters including PGA, SA at 0.2 s and 1s, and Amplification Factor are mapped.
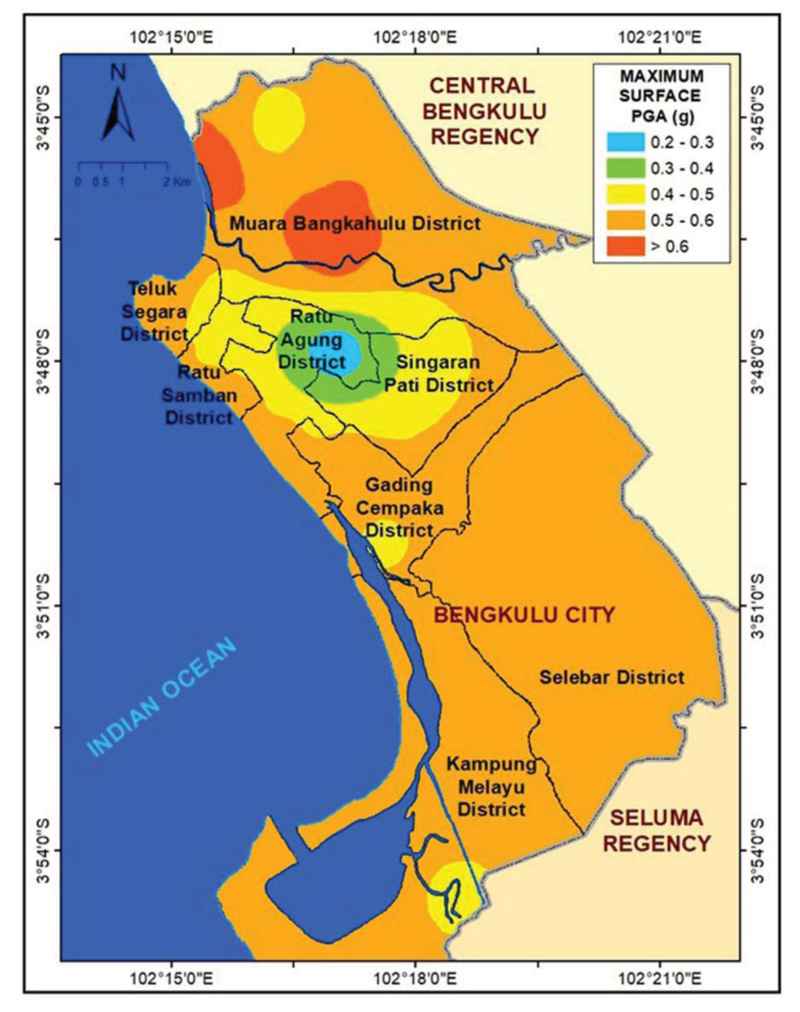
3.3. Microzonation of Peak Ground Acceleration
Fig. (9) presents the microzonation map of peak ground acceleration based on a one-dimensional seismic ground response analysis. From Fig. (9), it can be observed that PGA ranging from 0.5 to 0.6g is dominantly found in the study area. The areas dominated by this PGA range are Selebar District, Kampung Melayu District, Gading Cempaka District, Ratu Samban District, Teluk Segara District, and Ratu Samban District. Several small parts of PGA with a range of 0.4 to 0.5g are found in Singaran Pati District, Gading Cempaka District, Muara Bangkahulu District, and Kampung Melayu District. In Muara Bangkahulu District, PGA more than 0.6g is also found. Meanwhile, in Ratu Agung District, small parts of the PGA zone range from 0.2 to 0.4g. In line with the dominant peak ground acceleration in the study area, it can be observed that during the earthquake under a probabilistic scenario, the motion at the ground surface is categorised as moderate to strong motions [7]. It is predicted that the damage intensity level (Modified Mercalli Intensity) in the study area may be about IX to XI [48].
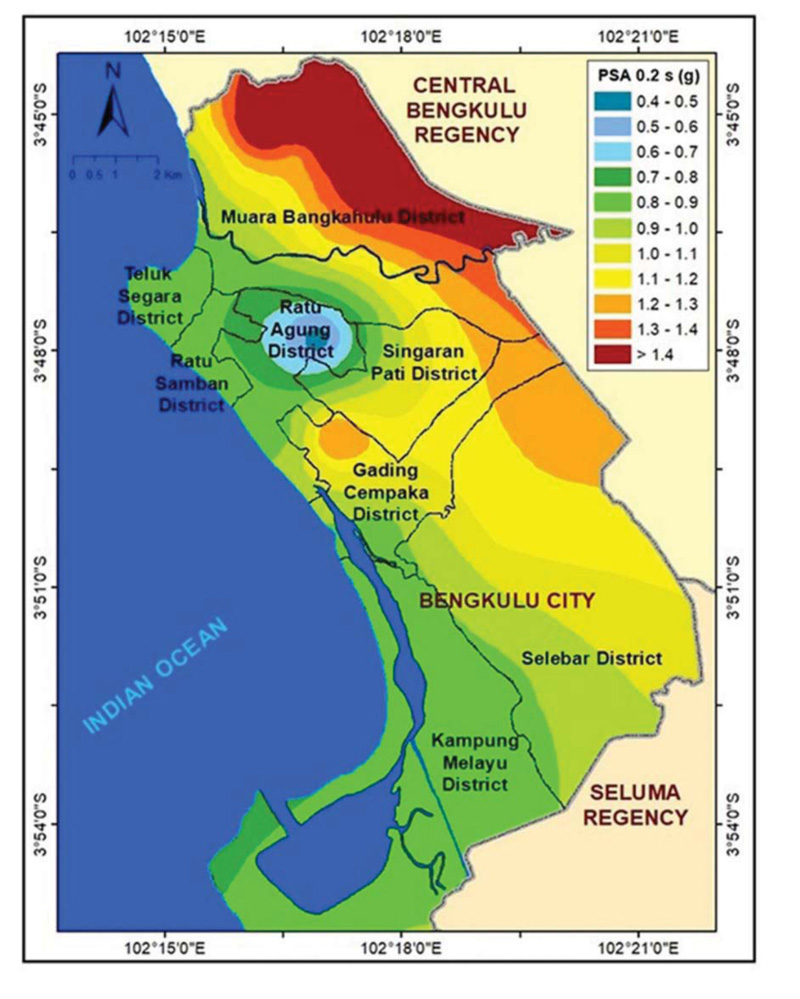
3.4. Microzonation of Spectral Acceleration at 0.2 s
Fig. (10) presents the microzonation map of spectral acceleration at the period of 0.2 (SA at 0.2s). SA at 0.2 is also used to generate spectral acceleration design. SA at 0.2 represents the response of structures for low-storey buildings. Based on Fig. (10), it can be observed that the value of spectral acceleration at 0.2 s is observed to vary from 0.4 to 1.4g. In general, spectral acceleration ranging from 0.9 to 1.2g is dominant in the study area. Several areas with the dominant spectral acceleration are found in Kampung Melayu District, Selebar District, Gading Cempaka District, Singaran Pati District, Ratu Agung District, Ratu Samban District, and Teluk Segara District. Generally, these areas are still located in the coastal area of Bengkulu City, with a distance of only 2 km from the coastline of Bengkulu City. It indicates that in these areas, the response of structures, especially low-rise buildings, is relatively large during the strong earthquake in the study area. This issue is also highlighted by Mase [4], who mentioned that during the Mw 8.6 Bengkulu-Mentawai Earthquake in 2007, spectral acceleration at sites located in the coastal area of Bengkulu City could reach more than 1.0g. In the northern part of Bengkulu City, i.e., Muara Bangkahulu District, the spectral acceleration value is more than 1.4g. In this area, the swamp deposit exists. The formation is dominated by soft and peat soils. Several studies conducted by Mase [4], Misliniyati et al. [36], Likitlersuang et al. [49] mentioned that soil response for a short period tends to be larger at sites dominated by soft soils, such as in Bengkulu (Indonesia), Jakarta (Indonesia), and Bangkok (Thailand). A study conducted seismic hazard analysis under deterministic and local site scenarios [8, 9] suggested that the area in the northern part of Bengkulu City also shows the largest spectral acceleration in a short period. Therefore, based on those previous studies combined with the results of this study, it can be concluded that the area dominated by the swamp area tends to have a large response in a short period.
3.5. Microzonation of Spectral Acceleration at 1 s
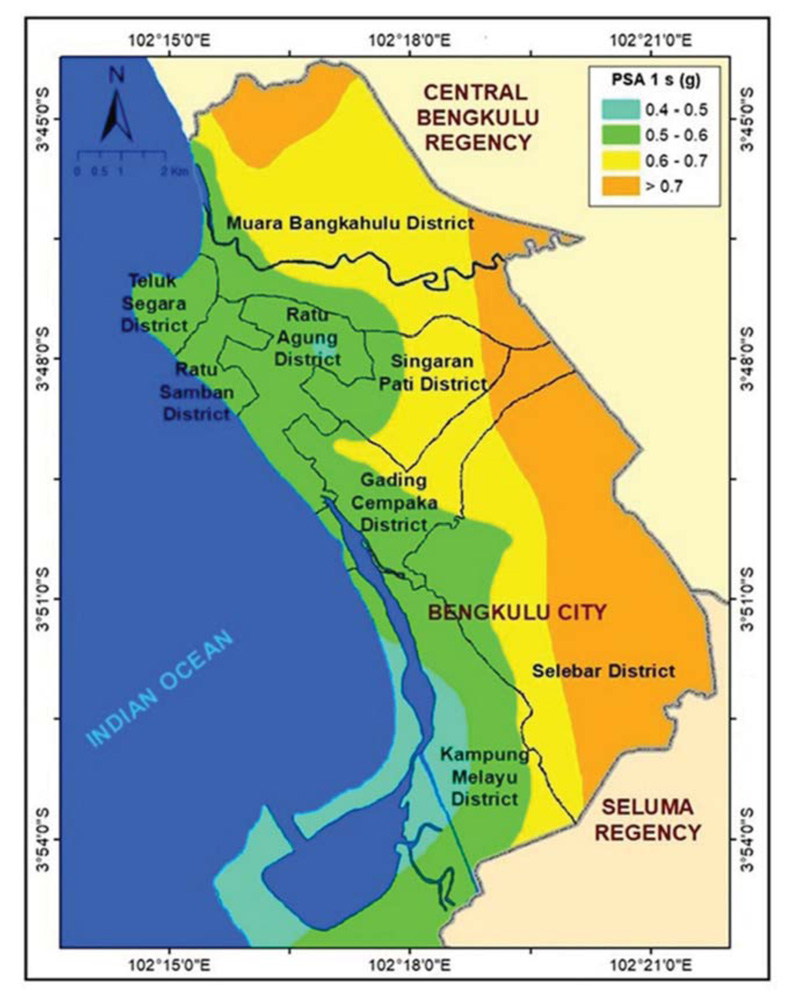
Fig. (11) presents spectral acceleration at 1 s (SA at 1 s). Similar to SA at 0.2 s, SA at 1 s represents the response for high-storey buildings and is also used to compose spectral acceleration design. Based on Fig. (11), it can be observed that there are three main zonations for SA at 0.1. Along coastal areas, SA at 1 s with the range of 0.5 to 0.6g is dominantly found. In the middle part of Bengkulu City, SA at 1, with a range of 0.6 to 0.7g is generally found. In the eastern part of Bengkulu City, SA at 1 s with a value of more than 0.7g is found. It indicates the farther east, the larger SA at 1 s.
Several studies on seismic hazard maps conducted by Mase [8, 9] also show that SA at 1 s generally gets larger in the eastern part. It is also important to highlight that the eastern part of Bengkulu City is generally dominated by Site Class C. It indicates that the depth of bedrock could be relatively shallow. At sites having shallow bedrock, spectral acceleration tends to amplify for a short period until the threshold of a long period. In this study, based on Fig. (8), the average spectral acceleration tends to decay at a period of 0.5s. However, a long period (SA at 1 s), the spectral acceleration tends to be still high. It indicates that during a strong earthquake, the high-storey buildings in the eastern part of Bengkulu could suffer high-response.
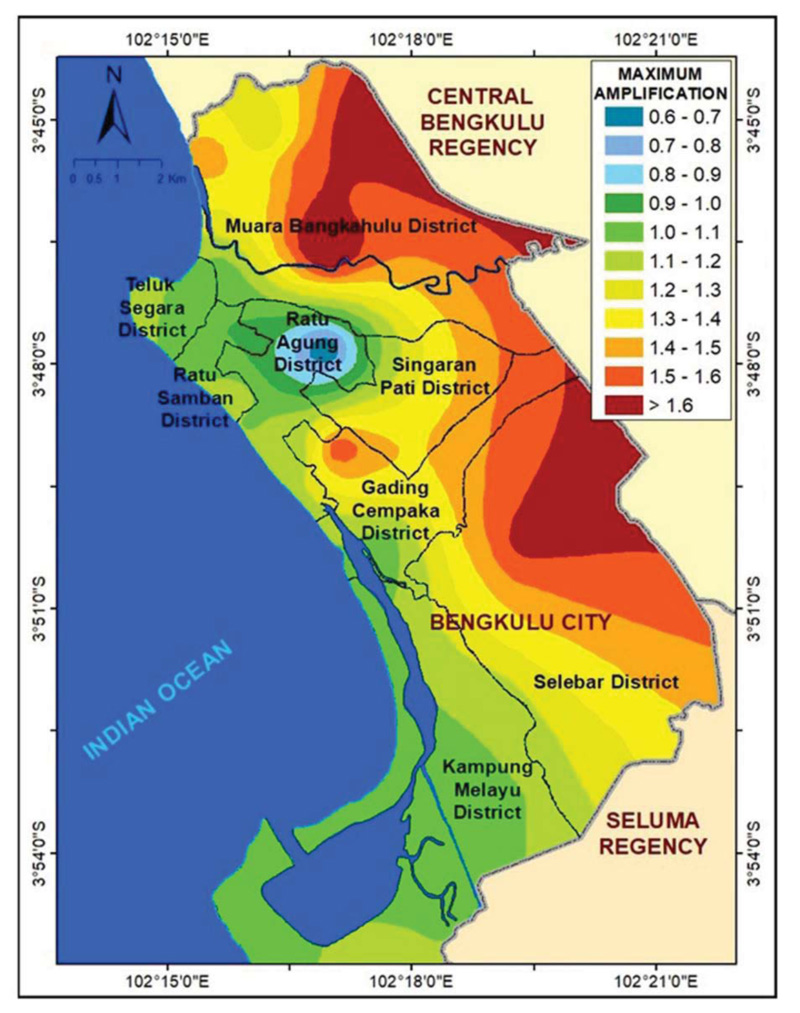
3.6. Microzonation of Ground Amplification Factor
In this study, it is important to check the ground amplification factor during seismic wave propagation in the study area. The ground amplification factor is derived based on the comparison between PGA at the surface and PGA of input motion. Fig. (12) presents the microzonation map of the amplification factor. In Fig. (12), it can be observed that there are many variations of amplification factors resulting from the analysis. The amplification factor is observed to vary from 0.6 to 1.6. It indicates that there are areas that underwent de-amplification and amplification. In the coastal area of Bengkulu City, the amplification factor is observed to vary from 1 to 1.2, whereas in the eastern part of Bengkulu City, the amplification factor is observed to vary from 1.5 to more than 1.6. Mase [8] also mentioned that based on the deterministic approach, the amplification factor in the coastal area of Bengkulu City is observed to vary from 1 to 1.2, whereas in the eastern part of Bengkulu City is observed to vary from 1.6 to more than 1.8. Mase [9] mentioned that based on local seismic design, the amplification factor in the coastal area of Bengkulu City is observed to vary from 1 to 1.1, whereas in the eastern part of Bengkulu City is observed to vary from 1.4 to more than 1.5. In general, the results obtained in this study are generally consistent with the seismic design map presented based on other approaches.
3.7. Spectral Acceleration Design Comparison
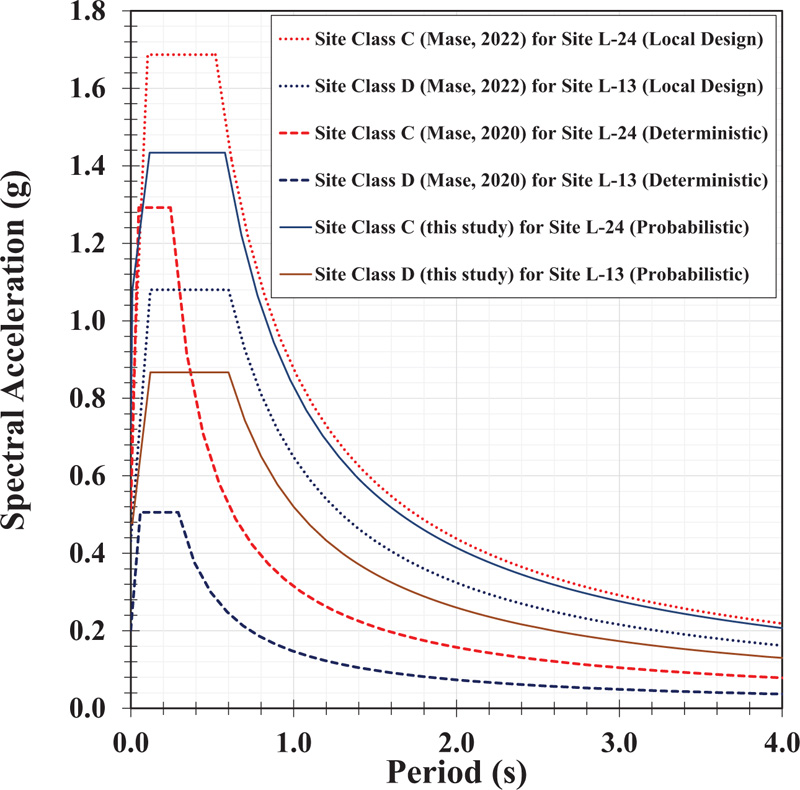
To observe the tendency of spectral acceleration design, the spectral acceleration design obtained from this study is compared to other spectral acceleration designs from other approaches, such as deterministic [8] and local seismic [9]. Fig. (13) presents the comparison of spectral acceleration design. In this study, the selected points that are based on previous studies are L-13 and L-24. L-13 represents the point categorised as Site Class D and L-24 represents the point categorised as Site Class C. Generally, both spectral acceleration designs for Site Class C and Site Class D overestimates spectral acceleration design from a deterministic approach but slightly underestimate spectral acceleration design from the local seismic approach. Overall, the spectral acceleration of Site Class C is relatively higher than the spectral acceleration of Site Class D. Based on microzonation map of SA at 0.2 s (Fig. 10), the larger SA at 0.2 s is generally found in the eastern part of Bengkulu City that is dominated by Site Class C. It may be the reason why the spectral acceleration design for Site Class C is higher than the spectral acceleration design for Site Class D. For spectral acceleration design at Site Class D, the tendency of constant peak spectral acceleration is similar to the spectral acceleration design constructed based on local seismic approach [9]. Based on Fig. (11), both spectral acceleration designs show constant peak spectral acceleration at a period of 0.12 s to 0.6 s. The same tendency for both spectral accelerations is also shown by peak constant spectral acceleration at a period of 0.11 to 0.59 s. Therefore, it can be concluded that the spectral acceleration design obtained from the probabilistic approach emphasizes on low to medium period in which it is related to the low to medium-rise buildings [4]. In Bengkulu City, the limitation on the allowed number of stories for the building is still enforced. In line with this study's finding, using a seismic hazard map can be relevant to compose spectral acceleration design for Bengkulu City.
CONCLUSION
This paper presents seismic hazard maps of Bengkulu City, Indonesia, considering probabilistic spectral responses for medium and stiff soils. Probabilistic spectral acceleration is used as target spectra for Site Classes C and D in Bengkulu City. The spectral matching method is implemented to generate input motion. Furthermore, seismic ground response analysis is conducted. Several maps of ground motion parameters, including PGA, SA at 0.2 s and 1s, and ground amplification factor, are mapped. Several concluding remarks are drawn:
1. In general, there are variations in ground motion parameters for the seismic hazard map in Bengkulu City. For example, the significant variations on PGA, SA at 0.2 s, SA at 1 sand ground amplification factor are generally found in Bengkulu City. The significant variation indicates the varied response of soils. The results also showed that ground motion parameters for Site Class C are relatively larger than Site Class D. This may be the effect of geological variation in Site Class C and shallow bedrock conditions. A contrast variation of seismic hazard maps occurs at the border between alluvium terraces and other geological formations, especially for SA at 0.2 s and ground amplification factor. A similar tendency is also observed in previous studies of seismic hazard maps under deterministic and local seismic approaches.
2. The performance of the spectral acceleration design obtained from this study is generally between deterministic and local seismic spectral acceleration. The performance of spectral acceleration design from the probabilistic approach tends to balance seismic design among deterministic and local seismic acceleration. Probabilistic spectral acceleration also shows that the critical period for site class is generally found at short to medium periods, i.e., 0.1 s to 0.16 s. In line with the development of Bengkulu City, building with a natural period of 0.1 to 0.6 s is generally categorised as short to medium storeys building. In Bengkulu City, the limitation on the allowed number of floors for the building is still enforced. Therefore, for efficient and economical design, the consideration of the local spectral acceleration could be emphasised to support integrated seismic hazard mitigation for the city's development.
3. The integrated study involving probabilistic seismic hazard assessment, ground motion development, and one-dimensional seismic ground response analysis could be reasonably implemented to produce the appropriate local seismic design. The analysis is also involving the actual geological condition in the study area. Therefore, the framework implemented in this study could be adopted to solve a similar problem in other areas.
LIST OF ABBREVIATIONS
| DSHA | = Deterministic Seismic Hazard Assessment |
| PSHA | = Probabilistic Seismic Hazard Assessment |
| PGA | = Peak Ground Acceleration |
| SA | = Spectral Acceleration |
CONSENT FOR PUBLICATION
Not applicable.
AVAILABILITY OF DATA AND MATERIALS
Data supporting the findings presented in the article are available upon reasonable request from correspoding author [S.K].
FUNDING
This research was supported by the Mandatory Research from the University of Bengkulu Research Fund Grant No. 3968/UN30.15/LT/2018.
CONFLICT OF INTEREST
The authors declare no conflict of interest, financial or otherwise.
ACKNOWLEDGEMENTS
The author also would like to thank Ms. Putri Widia Anggraini, B.Eng, Ms. Sintia Agustina, B.Eng, Mr. Yoga Dharma Arifandi, B.Eng and Ms. Ceri Eliesa Suhartini, B.Eng, for their assistance to analyse one-dimensional seismic ground response analysis and compose seismic micro-zonation maps. This study is also conducted under Japan ASEAN Science Technology Innovation Platform (JASTIP) WP-4, 2022.

