All published articles of this journal are available on ScienceDirect.

Determining the Coefficient of Behavior of Reinforced Concrete Frame Equipped with Steel Plate Shear Walls Based on FEMA P695 Analytical Method
Abstract
Introduction:
In recent decades, steel plate shear wall (SPSW) has been used as an efficient lateral strength system in steel structures. In this research, the seismic behavior of a relatively new system of reinforced concrete frame (RCF) equipped with SPSW has been investigated. Behavior coefficient, as the most important parameter of structural behavior, reduces the lateral forces of the earthquake and the structure with inelastic deformations, reduces the amount of earthquake energy, and structures are designed for less force than the amount of elastic behavior.
Methods:
Four low, mid, and high-rise models with 4, 8, 12 and 24-stories under 44 far-field records and 56 near-field earthquake records have been proposed by using FEMA P695. Ductility and coefficient of behavior of a relatively new system of RCF equipped with SPSW have been calculated according to the proposed method FEMA P695. Due to the significant number and relatively wide range of earthquake records used in the analysis and the use of incremental dynamic analysis (IDA), considering the inherent uncertainty in the earthquake, the results of the analysis are more valid.
Results:
The results of the analysis showed the coefficient of behavior of the RCF equipped with SPSW in the limit state to be equal to 8.7, and in the allowable stress state as equal to 12.5.
Conclusion:
A comparison of the calculated coefficient of behavior of RCF equipped with SPSW (8.7) with the proposed value of ASCE07-2010 (8) shows an increase of 8.75% that indicates this code to be conservative.
1. INTRODUCTION
Due to the need for accurate determination and the lack of a valid analytical method for determining seismic behavior coefficients, there have always been concerns about determining reliable behavior coefficients. Since the introduction of these coefficients, various methods have been introduced by various researchers to determine the seismic coefficients of the building, the most important of which are the methods of American researchers (Freeman capacity method and Yang ductility coefficient method) and European researchers’ methods (ductility theory method and energy method) [1]. Advances in seismic design based on performance and accessibility of laboratory data on the cyclic response of structural components have led to a new ability to use nonlinear collapse simulation techniques to evaluate the behavior of seismically resistant systems. The achievement of this new capability has led to the publication of the FEMA P695 report [2] to determine the coefficients of seismic behavior of buildings. In this research, the coefficients of behavior are evaluated based on the valid analytical method FEMA P695.
The philosophy of using the coefficient of behavior in the design process is that during an earthquake, the structures typically undergo deformations and stresses beyond the elastic limit, and the design of structures for lateral force in the elastic state causes the required large resistance, unrealistic , and requires the design of sections with large and non-economic dimensions. Therefore, the elastic lateral force is reduced by the parameter of the coefficient of behavior, which depends on factors, such as ductility, surplus strength, damping, etc., and the structure absorbs a large amount of seismic energy by tolerating inelastic deformations. Therefore, structures are designed for less force than the amount of elastic behavior in the structure.
Gholhaki et al. [3], in 2019, investigated the seismic behavior of RCF with steel shear walls, and the results of their research were that the standard design spectrum of 2800 Iranian earthquakes, especially for buildings near the earthquake zone, should be modified. They also concluded that distant basin earthquakes have a greater impact on low and mid-rise structures compared to near basin earthquakes and that near basin earthquakes have a greater impact on tall buildings.
SPSW is a type of system suitable for earthquake and wind lateral loads consist of a series of separate panels; each panel is enclosed inside two beams and columns, and a steel plate is connected to the surrounding elements [4]. The use of SPSW, due to stiffness, strength, and significant energy dissipation of seismic as an effective lateral system in seismic rehabilitation to increase the lateral strength and stiffness of buildings against earthquake (technical rehabilitation strategies) in steel structures is considered. Recently, the analysis and design of SPSW, which requires environmental elements (beams and columns) with high rigidity, to increase the lateral strength and stiffness of concrete buildings with a moment-resisting frame that inherently has such elementshave been carried out. Therefore, the reinforced concrete frame with SPSW has been proposed as a new system against lateral loads [5, 6].
Numerous studies have been done on structural systems, including resisting moment frames, braced systems, and concrete shear walls under earthquakes. However, the flexural frame system of reinforced concrete with steel shear wall has been studied from various aspects recently, and therefore, the seismic behavior of this system has not been studied. One of the important innovations of this research is the relatively comprehensive study of seismic behavior and the calculation of the coefficient of behavior of this system under the types of accelerometers of far and near-field proposed by FEMA-P695 [2].
2. MATERIALS AND METHODS
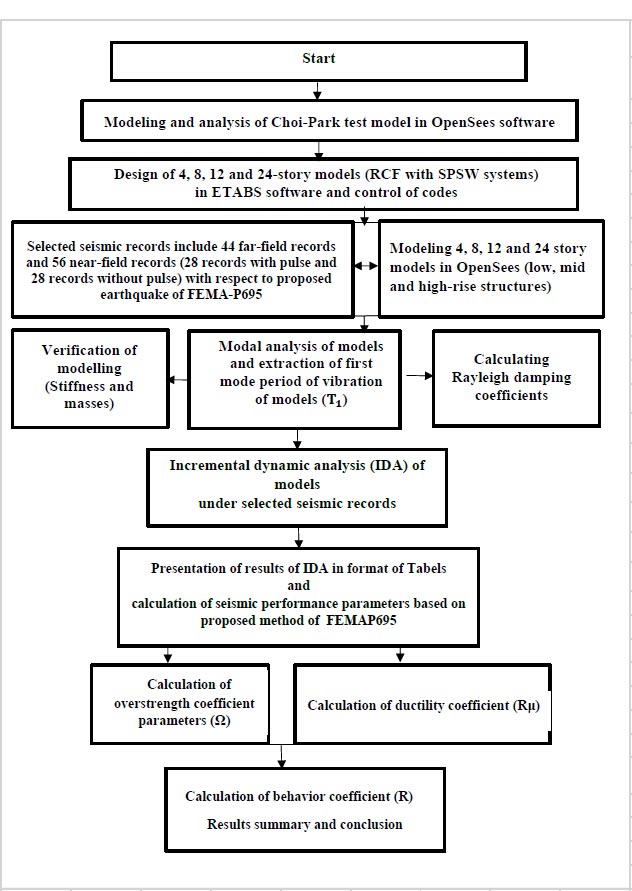
The method used in this research is presented in the form of a flowchart (Fig. 1). As shown in the figure, to validate the numerical analysis process, a 3-story experimental model of a concrete frame equipped with a steel plate infill wall [5], whose specifications are presented in Fig. (2), was simulated making use of OpenSees software [7]. Four 2D frames, including 4, 8, 12, and 24-story equipped with steel shear walls, were considered for the numerical analyses in this study. The 4, 8, 12, and 24-story frames corresponded to low, mid, and high-rise buildings, respectively. The first mode period of vibration of models (T1) was extracted. The design spectrums of 2800 Iranian earthquake codes were used. With the first fundamental period greater than 1 second, the design spectrums of the standard of 2800 Iranian earthquake multiply coefficient equaled 1.104 for the soil type III.
Steps 1 and 2 for the calculation of the coefficient behaviour of models are as follows:
Step 1: Design of 4, 8, 12, and 24-story models (RCF with SPSW systems) in ETABS software and control of codes.
Step 2: Incremental dynamic analysis (IDA) of models under selected seismic records, including 44 far-field records and 56 near-field records (28 records with pulse and 28 records without pulse) with respect to the proposed earthquake of FEMA-P695. The models were IDA analysed, and requested parameters were extracted.
Finally, the results were compared and concluded.
3. NUMERICAL MODELING VALIDATION OF RCF EQUIPPED WITH SPSW
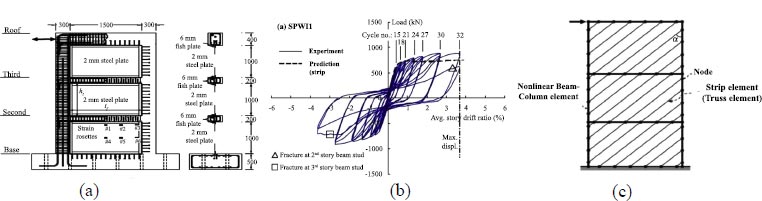
Validation of analytical models is one of the steps of research. In this research, in order to validate the model, the laboratory study of Choi and Park in 2011 [5], according to Fig. (2a), has been used. He conducted a laboratory study to investigate the cyclic behavior of walls consisting of boundary elements of reinforced concrete frames and thin steel sheets. In order to ensure the accuracy of the modeling, the numerical model of the laboratory sample was modeled and analyzed in OpenSees finite element software [7]. For modeling, the NonlinearBeamColumn element has been used for the beam and column elements with deformation control, which has the ability to take into account the P-Δ effect and large deformations. The strip method has been used to model the SPSW [8]. In this method, a truss element is used to model the tensile strips. To model the wide plasticity of the elements in the program, the cross sections of the beam and column elements are divided into a number of fibers. Concrete 01 and Steel 02 materials have been used for modeling concrete and steel materials of reinforcements, respectively. To model the actual behavior of the strips that should not react when pressed, hysteretic materials are used, with which the three-line behavior in tension and pressure gives the strips the property that does not show resistance when under pressure and allows the diagonal tensile field of a steel shear wall to be well modeled. Also, the discussion of concrete confinement of columns is seen in the model. Numerical results from cyclic loading are compared with laboratory results (Fig. 2b). The values of load-bearing capacity, initial stiffness, and energy absorption determined from the experiment and the corresponding simulated model are presented in Table 1. The comparison between the two diagrams in Fig. (2b) shows the acceptable accuracy in the modeling phase of this research. The finite element model with double-sided diagonal truss element in cyclic analysis has been presented in Fig. (2c).
| Energy Dissipation (kN.m) | Elastic Stiffness (kN/mm) | Lateral Load (kN) | ||||||
| Ratio | Finite | Test | Ratio | Finite | Test | Ratio | Finite | Test |
| Finite | Element | Finite | Element | Finite | Element | |||
| Element | Element | Element | ||||||
| to Test | to Test | to Test | ||||||
| 1.08 | 349.23 | 323.98 | 0.91 | 48 | 53 | 1.02 | 903 | 886 |
4. MODELING IN ETABS SOFTWARE AND DESIGN OF SPSW
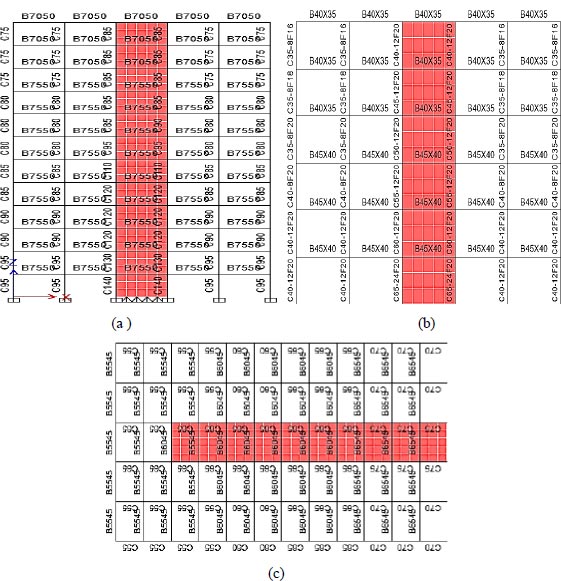
Regarding the classification of structural systems, some have considered the ratio of the height to the smallest horizontal dimension of the structure as a criterion for classifying buildings, and height to the smallest dimension ratios greater than 1.5 π, between π and 1.5 π, between π and 0.5 π and less than 0.5 π are known as tall, high, mid and low-rise buildings, respectively [9]. Accordingly, in this research, four models of 4, 8, 12, and 24 story with height to the smallest dimension ratios of 0.54, 1.09, 1.63, and 3.26, respectively, in the classification of low, mid and high-rise structures with a rectangular plan, according to Fig. (2a), are selected with a reinforced concrete frame with steel plate shear wall and high ductility. The height of the stories of the models is 3.4 meters, and the roof is considered as a block joist. The construction site of the structures is considered to be a high earthquake risk and soil type III. Concrete used in C22 grade concrete structures has a characteristic strength of 220 kg/cm2 and rebars of type A3 with a yield stress of 4000 kg/cm2. The steel used for equivalent braces is soft construction steel with a yield stress of 2400 kg/cm2. In the analysis and design of the studied structures, the sixth [10] and ninth [11] national building regulations and the Iranian 2800 earthquake standard, fourth edition [12], have been used; according to the sixth of the National Building Regulations, the dead weight load of stories and roof is 640 kg/cm2, the live load of stories and roof is 200 kg/cm2, and the load of walls of stories is 600 kg/m. For the design of structures, according to the results of laboratory work performed on an RCF with SPSW and the criteria set by the American loading code ASCE07-2010 [13] for steel plate shear wall, the behavior factor 8 for the reinforced concrete equipped with SPSW lateral system was used [13]. In order to design thin SPSW, according to Canadian and American steel regulations, an equivalent brace is considered instead of each steel plate, and after calculating the cross-sectional area of each brace, the thickness of the steel plate is calculated using eq (1).
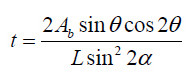 |
(1) |
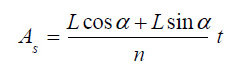
Where, θ is the angle between the brace and the column, L is the span of the frame, Ab is the equivalent cross-sectional area of the brace,and α is the angle of formation of the diagonal tensile field in the steel plate. After determining the thickness, each plate is converted into a number of diagonal strips; the cross-section area of each strip can be obtained from eq 2.
 |
(2) |
Where, n is the number of bars. Numerous studies have been performed on the number of required strips, the results of which indicate the adequacy of 10 diagonal strips for the analysis of a thin shear steel shear wall. Given that the columns may buckle under the influence of the diagonal tensile field, the stiffness of the columns should be controlled by eq 3.
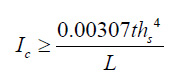 |
(3) |
Where, Ic is the moment of inertia of the columns, and
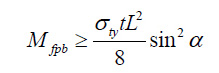 |
(4) |
Where, Mfpb is the plastic anchor of the cross-section of the beam and σty is the final stress of the diagonal tensile field, which for thin plates is equal to their yield stress. Due to the small difference in the intensity of the diagonal tensile field between two adjacent stories, control of this relationship is required only for the end beam, but if the difference between the diagonal tensile fields between two adjacent stories is large, the relationship should be controlled for the middle beams.
In order to ensure that the perimeter columns can withstand the stresses due to the environmental loads along with the stresses due to the tensile field effect, it is necessary to check eq 5 for the plastic anchor of the columns:
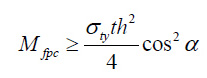 |
(5) |
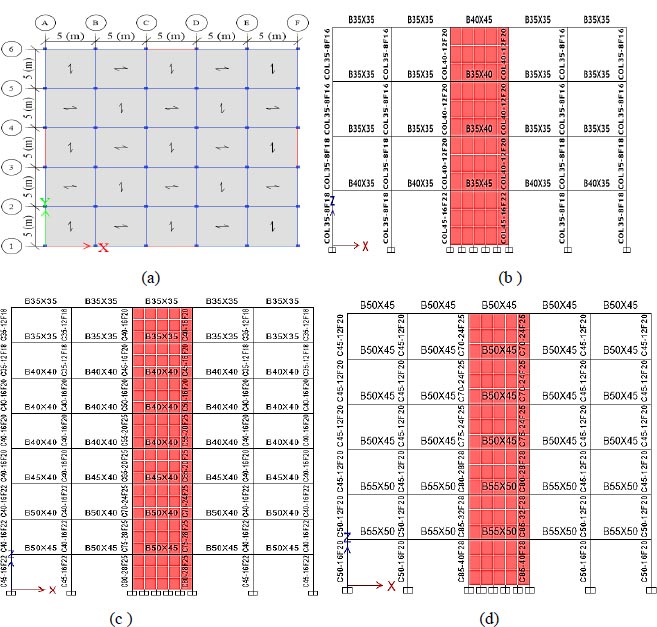
Equivalent tensile bracing was used to model the steel plate shear wall in the design stages due to the impossibility of modeling the steel plate in the model geometry and its analysis by ETABS software. In the last two stories of the 24-story model, due to the negative shear in the braces, the use of an SPSW in these stories was avoided in the structure, and only the special reinforced concrete frame system was used to deal with the lateral force. Designed structural sections of 4, 8, 12, and 24 story models are presented in Figs. (3 and 4), and the details of these models are presented in Tables 2 to 5.
| Story | Section Columns | Section Beams | Section Columns | Section Beams of other Bays (cm) (Width × Height) | SPSW Plate Thickness (mm) |
| of SPSW Bay (cm) | of SPSW Bay (cm) | of other Bays (cm) | |||
| 1 | C45×45-16 Ø 22 | B 35× 45 | C 35×35-8 Ø 18 | B 35×40 | 1.6 |
| 2 | C40×40-12 Ø 20 | B 35 × 40 | C 35×35 -8 Ø 18 | B 35×35 | 1.6 |
| 3 | C40×40-12 Ø 20 | B 35 × 40 | C 35×35- 8 Ø 16 | B 35×35 | 1.6 |
| 4 | C40×40-12 Ø 20 | B 45× 40 | C 35×35- 8 Ø 16 | B 35×35 | 1.1 |
| Story | Section Columns | Section Beams | Section columns | Section Beams of Other Bays (cm) (Width× Height) | SPSW Plate Thickness (mm) |
| of SPSW bay (cm) | of SPSW bay(cm) | of other bays (cm) | |||
| 1 | C 80×80-32Ø 28 | B 80 ×40 | C 45×45-8 Ø 18 | B 45 ×50 | 2.1 |
| 2 | C 80×80 -32Ø 25 | B 80 ×40 | C 40×40 -8 Ø 18 | B 45 ×50 | 2.1 |
| 3 | C 75×75 -28 Ø 25 | B 75 ×40 | C40×40 -8 Ø 18 | B 45 ×50 | 2.1 |
| 4 | C 70×70 -24 25 | B 70 ×40 | C45×45-8 Ø 18 | B 45 ×50 | 1.8 |
| 5 | C 65×65 -20Ø 22 | B 65 ×40 | C 40×40 -8 Ø 16 | B 40×40 | 1.8 |
| 6 | C 60×60 -16 Ø 20 | B 60 ×40 | C 40×40 -8 Ø 16 | B 40×40 | 1.8 |
| 7 | C 60×60 -12Ø 18 | B 60 ×40 | C 40×40 -8 Ø 16 | B 40×40 | 1.6 |
| 8 | C 60×60 -8 Ø 18 | B 60 ×60 | C 35×35 -8 Ø 16 | B 35×35 | 1.1 |
| Story | Section columns | Section beams | Section Columns | Section Beams of Other Bays (cm) (Width× Height) | SPSW Plate Thickness (mm) |
| of SPSW bay (cm) | of SPSW bay (cm) | of other bays (cm) | |||
| 1 | C 95×95-52 Ø 32 | B 95 ×55 | C 50×50-16 Ø 20 | B 50 ×55 | 2.1 |
| 2 | C 95×95-52 Ø 32 | B 95 ×55 | C 50×50-12 Ø 20 | B 50 ×55 | 2.1 |
| 3 | C 95×95- 48Ø 28 | B 95 ×55 | C 45×45- 12Ø 20 | B 45 ×55 | 2.1 |
| 4 | C 90×90- 48Ø 28 | B 90 ×50 | C 45×45- 12Ø 20 | B 45 ×50 | 2.1 |
| 5 | C 85×85-40 Ø 28 | B 85 ×50 | C 45×45-12 Ø 20 | B 45 ×50 | 1.8 |
| 6 | C 80×80-24Ø 28 | B 80 ×50 | C 45×45-12Ø 20 | B 45 ×50 | 1.8 |
| 7 | C 75×75-24 Ø 25 | B 75 ×45 | C 40×40-12 Ø 20 | B 40 ×45 | 1.8 |
| 8 | C 70×70-24 Ø 20 | B 70 ×45 | C 40×40-12 Ø 20 | B 40 ×45 | 1.8 |
| 9 | C 65×65- 16Ø 20 | B 65 ×45 | C 40×40- 8Ø 20 | B 40 ×45 | 1.6 |
| 10 | C 60×60-12Ø 20 | B 60 ×40 | C 35×35-8Ø 20 | B 35 ×40 | 1.6 |
| 11 | C 60×60-12 Ø 20 | B 60 ×40 | C 35×35-8 Ø 18 | B 35 ×40 | 1.36 |
| 12 | C 60×60-12 Ø 20 | B 60 ×60 | C 35×35-8 Ø 18 | B 35 ×40 | 1.1 |
| Story | Section columns | Section columns | Section columns | Section beams | Section beams | Plate thickness of SPSW (mm) |
| of SPSW bay (cm) | of adjacent SPSW (cm) | of other bays (cm) | of SPSW and external bays (cm) | of adjacent SPSW (cm) | ||
| 1 | C 105×105 -25 Ø 52 | C 80×80-25 Ø 32 | C 80×80-25 Ø 24 | B 70 × 70 | B 65 × 65 | 4.4 |
| 2 | C 100×100-25 Ø 48 | C 80×80-25 Ø 28 | C 80×80-20 Ø 24 | B 70 × 70 | B 65 × 65 | 3.2 |
| 3 | C 95×95- 25 Ø 44 | C 80×80- 25 Ø 28 | C 80×80-20 Ø 24 | B 70 × 70 | B 65 × 65 | 3.2 |
| 4 | C 90×90-25 Ø 40 | C 75×75-25 Ø 28 | C 75×75- 20 Ø 24 | B 70 × 70 | B 65 × 65 | 3.2 |
| 5 | C 90×90-25 Ø 40 | C 75×75-25 Ø 28 | C 75×75-20 Ø 24 | B 70 × 70 | B 65 × 65 | 3.2 |
| 6 | C-80×80 - 25 Ø 36 | C 70×70- 25 Ø 28 | C 70×70-20 Ø 24 | B 70 × 70 | B 65 × 65 | 3.2 |
| 7 | C 80×80-25 Ø 48 | C 70×70-20 Ø 24 | C 70×70-20 Ø 24 | B 70 × 70 | B 65 × 65 | 3.2 |
| 8 | C 80×80-25 Ø 28 | C 70×70-20 Ø 24 | C 70×70-20 Ø 20 | B 70 × 70 | B 65 × 65 | 3.2 |
| 9 | C 75×75-25 Ø 28 | C 70×70-20 Ø 24 | C 70×70- 20 Ø 20 | B 70 × 70 | B 65 × 65 | 2.9 |
| 10 | C 75×75- 25 Ø 24 | C 70×70- 20 Ø 24 | C 710×70-20 Ø 20 | B 60 × 60 | B 55 × 55 | 2.9 |
| 11 | C 70×70-25 Ø 24 | C 65×65-20 Ø 24 | C 65×65-20 Ø 16 | B 60 × 60 | B 55 × 55 | 2.9 |
| 12 | C 65×65- 25 Ø 24 | C 60×60- 20 Ø 24 | C 60×60-18 Ø 16 | B 60 × 60 | B 55 × 55 | 2.9 |
| 13 | C 65×65- 25 Ø 24 | C 60×60-20 Ø 24 | C 60×60-18 Ø 16 | B 60 × 60 | B 55 × 55 | 2.9 |
| 14 | C 60×60- 25 Ø 24 | C 55×55 -20 Ø 24 | C 55×55-18 Ø 16 | B 50 × 50 | B 50 × 50 | 2.9 |
| 15 | C 55×55-20 Ø 24 | C 55×55-20 Ø 24 | C 55×55-18 Ø 16 | B 50 × 50 | B 50 × 50 | 2.9 |
| 16 | C 55×55 -18 Ø 24 | C 50×50-18 Ø 24 | C 50×50-12 Ø 18 | B 50 × 50 | B 50 × 50 | 2.6 |
| 17 | C 50×50-18 Ø 24 | C 50×50-18 Ø 24 | C 50×50 - 12 Ø 18 | B 50 × 50 | B 50 × 50 | 2.1 |
| 18 | C 50×50- 18 Ø 24 | C 45×45 - 18 Ø 24 | C 45×45 - 12 Ø 16 | B 50 × 50 | B 50 × 50 | 2.1 |
| 19 | C 45×45 - 18 Ø 24 | C 45×45 - 18 Ø 24 | C 45×45- 12 Ø 18 | B 50 × 50 | B 50 × 50 | 1.8 |
| 20 | C 45×45- 18 Ø 24 | C 45×45- 18 Ø 24 | C 45×45- 12 Ø 18 | B 50 × 50 | B 50 × 50 | 1.8 |
| 21 | C 40×40- 18 Ø 20 | C 40×40- 18 Ø 20 | C 40×40- 12 Ø 16 | B 40 × 40 | B 40 × 40 | 1.6 |
| 22 | C 40×40- 18 Ø 20 | C 40×40- 18 Ø 20 | C 40×40 -12 Ø 16 | B 40 × 40 | B 40 × 40 | 1.6 |
| 23 | C 40×40- 18 Ø 18 | C 40×40- 18 Ø 16 | C 40×40-12 Ø 16 | B 40 × 40 | B 40 × 40 | 1.36 |
| 24 | C 40×40 - 18 Ø 18 | C 40×40- 18 Ø 16 | C 40×40- 12 Ø 16 | B 60 × 40 | B 40 × 40 | 1.1 |
The result of modal analysis, the first mode period of vibration of models (
5. MODELING IN OPENSEES
For modeling of beam and column elements (Nonlinear Beam Column) in OpenSees, the effect of P-Δ and large deformation on the beams and columns is taken into account. For modeling of SPSW, the strip method is used. In this method, for the tensile strip, the truss element is used. For the concrete and steel reinforcement materials, respectively, Concrete01 and Steel02 materials are used. For determining the actual behavior of strips, hysteretic materials are used, which allow the use of diagonal tension steel plate shear. Also, concrete confinement of columns is considered in the model. OpenSees uses the distributed plasticity by the fiber element. Regarding geometric nonlinearity, it should be said that the effects of geometric nonlinearity are defined by the transfer matrices that are a feature of OpenSees. In the mentioned program, after defining the geometry of the model, the gravitational analyses are gravitationally analyzed (non-linear static), and by setting the time in the amplitude of the problem to zero before performing the nonlinear dynamic analysis, the gravitational load values remain constant in subsequent dynamic analyses. The effect of P-Delta is considered in the analyses.
| Model | Lateral Bearing System | T1(s) | Dy(cm) | Dmax(cm) | Vy(T) | µ=Dmax/Dy | Ky=Vy/Dy(T/cm) |
| 4-story | RCF+SPSW | 0.32 | 7 | 35 | 198 | 5.0 | 28.29 |
| 8-story | RCF+SPSW | 0.63 | 18 | 81 | 285 | 4.5 | 15.8 |
| 12-story | RCF+SPSW | 0.88 | 28 | 163 | 408 | 5.82 | 14.6 |
| 24-story | RCF+SPSW | 1.56 | 40 | 163 | 496 | 4.08 | 12.4 |
Due to the fact that in the case of surrounding frames with considerable stiffness and random rotation relative to the middle frames, for the analysis of the structure designed in Etabs, surrounding frames and their specifications have been used for two-dimensional nonlinear analysis. In order to take into account the effects of P-Delta, the column leaning method has been used. In fact, the concept of a leaning column is used to consider the effect of P-Delta due to gravitational loads.
6. INVESTIGATING THE BEHAVIOR OF STRUCTURAL MODELS THROUGH INCREMENTAL DYNAMIC ANALYSIS
The method of incremental dynamic analysis [14] was first proposed in 2000 by Professor Cornell at Stanford University, and in 2002, it was examined for a 20-story building during Dr. Vamwaticus' project under the supervision of Professor Cornell. In fact, IDA incremental dynamic analysis is a nonlinear dynamic analysis that can be used to determine the amount of damage to the structure in terms of the intensity of the earthquake stimulus.
6.1. Selected Seismic Records in Nonlinear Dynamic Analysis
One of the most important factors in the incremental dynamic analysis is determining the appropriate number of earthquake recordsAs the results of the analysis are largely dependent on the selected records, the higher the number of records used, the more valid the analysis results. Accordingly, in this study, according to the FEMA P695 recommendation, 44 far-field records and 56 near-field records (28 records with pulse and 28 records without pulse) have been used. However, Shome and Cornell [15] recommended that 10 to 20 records be used. The proposed FEMA P695 records have the maximum ground acceleration with the minimum, medium, and maximum values equal to 0.21 g, 0.43 g, and 0.82 g, respectively.
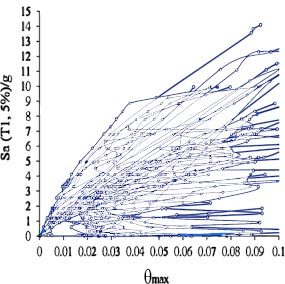
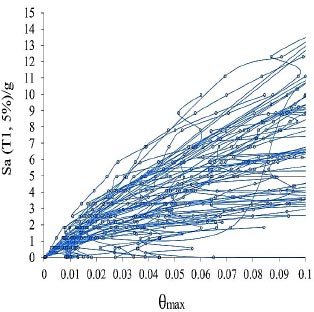
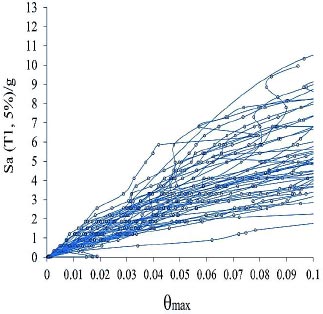
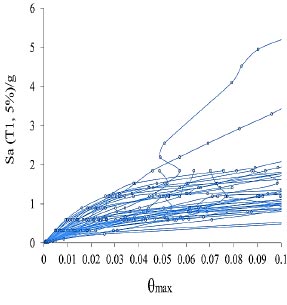
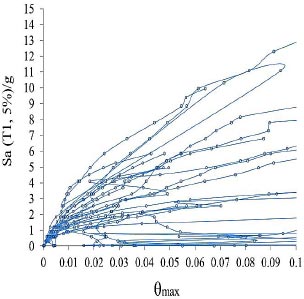
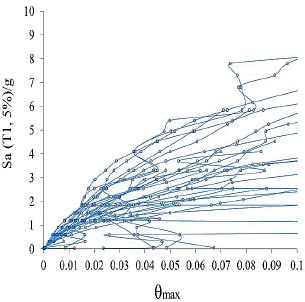
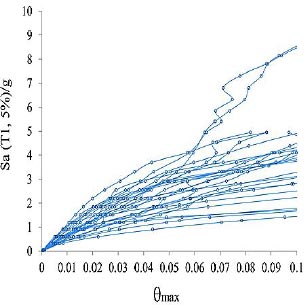
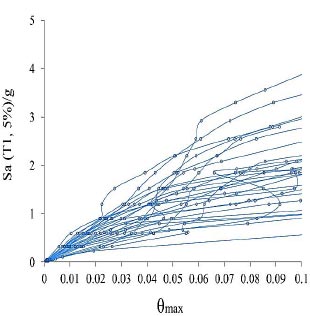
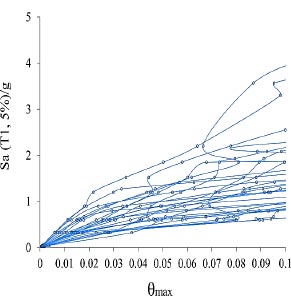
6.2. Results of Incremental Dynamic Analysis for Far-field Records
Models with far-field records of the earthquake of FEMA-P695 are increasingly analyzed by using nonlinear dynamic analysis, and the results of these analyses are presented for 4, 12, 8, and 24 story models, respectively (Figs. 5-8).
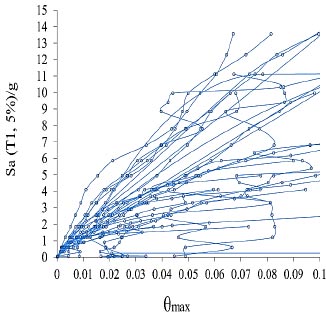
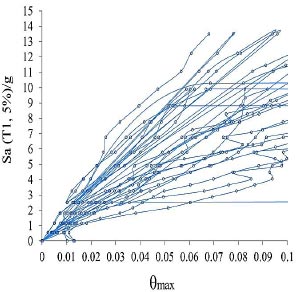
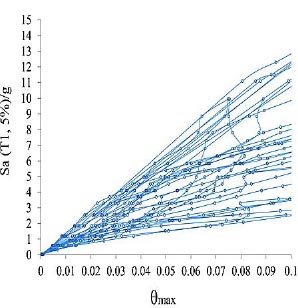
6.3. Results of Incremental Dynamic Analysis for Near-field Records with and Without Pulse
Models with near-field with and without records of the earthquake of FEMA-P695 are increasingly analyzed by using nonlinear dynamic analysis, and the results of these analyses are presented for 4, 12, 8 and 24-story models, respectively (Figs. 9-16).
| Model | 4-story | 8-story | 12-story | 24-story |
| V(st,y) ton | 119 | 141 | 238 | 336 |
6.4. Calculation of Sseismic Performance Parameters Based on FEMAP695
Behavior coefficient, R, overstrength coefficient, Ω, and ductility coefficient Rμ are the calculated parameters. By definition, the coefficient of overstrength (Ω) in the FEMA-P695 is the ratio of the maximum yield strength of the system to the base design shear. In this study, the overstrength coefficient Ω determines the additional strength in the structure between the point of formation of the first plastic joint (Table 7), vs, and the overall yield point of the structure, Vmax. Using incremental nonlinear analysis, the coefficient of extra strength is obtained by dividing the dynamic base shear of the failure to a static base shear equivalent to the formation of the first plastic joint in the structure according to eq (6).
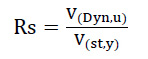 |
(6) |
In this method, the ductility coefficient is obtained by using the results of linear and nonlinear incremental dynamic analyses by dividing the linear state base shear by the nonlinear state base shear eq (7).
 |
(7) |
Vb (Dyn, e): Dynamic base shear in the linear behavior mode of the structure.
Vb (Dyn, u): Dynamic base shear in nonlinear mode.
Finally, the results of incremental dynamic analysis of structural models under 44 far-field records related to the coefficients of additional strength and ductility are presented in Tables 8 and 9. The values of the coefficient of behavior of the structural models in the limit states and allowable stresses are given under the mentioned records in Table 10. In order to examine the dispersion of the results, the coefficient of variation (CV) is calculated at the end of Table 10; as it is less than 0.4, it shows that the dispersion of data is less and has a higher generality.
| Record | 4-tory | 8-story | 12-story | 24-story | ||||
| Failure | Over strength Coefficient | Failure Resistance | Over strength Coefficient | Failure Resistance | Over strength Coefficient | Failure Resistance | Over strength Coefficient | |
| Resistance | ||||||||
| 1 | 280 | 2.35 | 417 | 2.94 | 647 | 2.72 | 732 | 2.18 |
| 2 | 276 | 2.32 | 484 | 3.42 | 701 | 2.95 | 572 | 1.7 |
| 3 | 256 | 2.15 | 390 | 2.75 | 705 | 2.96 | 967 | 2.88 |
| 4 | 306 | 2.57 | 541 | 3.82 | 832 | 3.5 | 1128 | 3.36 |
| 5 | 328 | 2.76 | 426 | 3.01 | 714 | 3 | 1152 | 3.43 |
| 6 | 295 | 2.48 | 429 | 3.03 | 640 | 2.69 | 1126 | 3.35 |
| 7 | 286 | 2.4 | 434 | 3.06 | 661 | 2.78 | 823 | 2.45 |
| 8 | 347 | 2.92 | 391 | 2.76 | 685 | 2.88 | 732 | 2.18 |
| 9 | 327 | 2.75 | 421 | 2.97 | 656 | 2.76 | 957 | 2.85 |
| 10 | 303 | 2.55 | 451 | 3.18 | 787 | 3.31 | 683 | 2.03 |
| 11 | 275 | 2.31 | 469 | 3.31 | 752 | 3.16 | 794 | 2.36 |
| 12 | 329 | 2.76 | 457 | 3.23 | 906 | 3.81 | 1028 | 3.06 |
| 13 | 291 | 2.45 | 444 | 3.13 | 665 | 2.79 | 1102 | 3.28 |
| 14 | 320 | 2.69 | 416 | 2.94 | 692 | 2.91 | 864 | 2.57 |
| 15 | 289 | 2.43 | 414 | 2.92 | 570 | 2.39 | 1163 | 3.46 |
| 16 | 290 | 2.44 | 379 | 2.68 | 614 | 2.58 | 1175 | 3.5 |
| 17 | 259 | 2.18 | 520 | 3.67 | 721 | 3.03 | 1043 | 3.1 |
| 18 | 307 | 2.58 | 388 | 2.74 | 762 | 3.2 | 1100 | 3.27 |
| 19 | 257 | 2.16 | 398 | 2.81 | 538 | 2.26 | 844 | 2.51 |
| 20 | 257 | 2.16 | 451 | 3.18 | 641 | 2.69 | 811 | 2.41 |
| 21 | 266 | 2.24 | 515 | 3.64 | 772 | 3.24 | 962 | 2.86 |
| 22 | 280 | 2.35 | 445 | 3.14 | 754 | 3.17 | 641 | 1.91 |
| 23 | 278 | 2.34 | 450 | 3.18 | 686 | 2.88 | 740 | 2.2 |
| 24 | 256 | 2.15 | 520 | 3.67 | 862 | 3.62 | 541 | 1.61 |
| 25 | 317 | 2.66 | 555 | 3.92 | 800 | 3.36 | 1322 | 3.93 |
| 26 | 291 | 2.45 | 410 | 2.89 | 617 | 2.59 | 1353 | 4.03 |
| 27 | 289 | 2.43 | 402 | 2.84 | 599 | 2.52 | 1261 | 3.75 |
| 28 | 297 | 2.5 | 307 | 2.17 | 570 | 2.39 | 1110 | 3.3 |
| 29 | 353 | 2.97 | 523 | 3.69 | 856 | 3.6 | 1563 | 4.65 |
| 30 | 312 | 2.62 | 443 | 3.13 | 659 | 2.77 | 1305 | 3.88 |
| 31 | 275 | 2.31 | 399 | 2.82 | 532 | 2.24 | 729 | 2.17 |
| 32 | 305 | 2.56 | 470 | 3.32 | 975 | 4.1 | 1024 | 3.05 |
| 33 | 277 | 2.33 | 369 | 2.6 | 546 | 2.29 | 839 | 2.5 |
| 34 | 270 | 2.27 | 385 | 2.72 | 492 | 2.07 | 961 | 2.86 |
| 35 | 302 | 2.54 | 466 | 3.29 | 723 | 3.04 | 1244 | 3.7 |
| 36 | 312 | 2.62 | 501 | 3.54 | 816 | 3.43 | 1087 | 3.24 |
| 37 | 298 | 2.5 | 383 | 2.7 | 598 | 2.51 | 670 | 1.99 |
| 38 | 334 | 2.81 | 402 | 2.84 | 729 | 3.06 | 1033 | 3.07 |
| 39 | 326 | 2.74 | 538 | 3.8 | 812 | 3.41 | 1707 | 5.08 |
| 40 | 308 | 2.59 | 586 | 4.14 | 1010 | 4.24 | 602 | 1.79 |
| 41 | 336 | 2.82 | 444 | 3.13 | 631 | 2.65 | 779 | 2.32 |
| 42 | 349 | 2.93 | 464 | 3.28 | 657 | 2.76 | 795 | 2.37 |
| 43 | 311 | 2.61 | 375 | 2.65 | 651 | 2.74 | 547 | 1.63 |
| 44 | 275 | 2.31 | 426 | 3.01 | 704 | 2.96 | 870 | 2.59 |
| Record | 24-story | 12-story | 8-story | 4-story | ||||
| Linear base shear | Ductility Coefficient | Linear base shear | Ductility Coefficient | Linear base shear | Ductility Coefficient | Linear base shear | Ductility Coefficient | |
| 1 | 810 | 2.89 | 1875 | 4.5 | 4129 | 6.38 | 1184 | 1.62 |
| 2 | 760 | 3.35 | 1434 | 2.96 | 4686 | 6.68 | 1146 | 2 |
| 3 | 1013 | 3.96 | 579 | 1.48 | 2207 | 3.13 | 3476 | 3.59 |
| 4 | 1772 | 5.79 | 2588 | 4.78 | 5123 | 6.16 | 1748 | 1.55 |
| 5 | 610 | 1.86 | 1371 | 3.22 | 2933 | 4.11 | 2619 | 2.27 |
| 6 | 869 | 2.95 | 2534 | 5.91 | 3755 | 5.87 | 1384 | 1.23 |
| 7 | 1092 | 3.82 | 863 | 1.99 | 1523 | 2.3 | 1645 | 2 |
| 8 | 901 | 2.6 | 1046 | 2.68 | 3012 | 4.4 | 2544 | 3.48 |
| 9 | 656 | 2.01 | 1229 | 2.92 | 2366 | 3.61 | 3428 | 3.58 |
| 10 | 1090 | 3.6 | 1718 | 3.81 | 2622 | 3.33 | 1215 | 1.78 |
| 11 | 686 | 2.49 | 2164 | 4.61 | 5525 | 7.34 | 1561 | 1.97 |
| 12 | 1125 | 3.42 | 1791 | 3.92 | 3261 | 3.6 | 4235 | 4.12 |
| 13 | 683 | 2.35 | 1853 | 4.17 | 2765 | 4.16 | 1663 | 1.51 |
| 14 | 1343 | 4.2 | 847 | 2.04 | 2042 | 2.95 | 2025 | 2.34 |
| 15 | 1089 | 3.77 | 826 | 2 | 1325 | 2.32 | 4424 | 3.8 |
| 16 | 589 | 2.03 | 1099 | 2.9 | 3937 | 6.41 | 4457 | 3.79 |
| 17 | 447 | 1.73 | 983 | 1.89 | 1651 | 2.29 | 1313 | 1.26 |
| 18 | 691 | 2.25 | 697 | 1.8 | 608 | 0.8 | 2262 | 2.06 |
| 19 | 1193 | 4.64 | 1467 | 3.69 | 2469 | 4.59 | 1834 | 2.17 |
| 20 | 1194 | 4.65 | 2117 | 4.69 | 3792 | 5.92 | 1528 | 1.88 |
| 21 | 627 | 2.36 | 1521 | 2.95 | 3238 | 4.19 | 1578 | 1.64 |
| 22 | 951 | 3.4 | 1806 | 4.06 | 5234 | 6.94 | 1225 | 1.91 |
| 23 | 920 | 3.31 | 2453 | 5.45 | 4052 | 5.91 | 1535 | 2.07 |
| 24 | 1680 | 6.56 | 1840 | 3.54 | 3168 | 3.68 | 1007 | 1.86 |
| 25 | 1173 | 3.7 | 2125 | 3.83 | 3312 | 4.14 | 4785 | 3.62 |
| 26 | 620 | 2.13 | 747 | 1.82 | 2262 | 3.67 | 7578 | 5.6 |
| 27 | 706 | 2.44 | 1303 | 3.24 | 2254 | 3.76 | 4575 | 3.63 |
| 28 | 726 | 2.44 | 380 | 1.24 | 1745 | 3.06 | 4762 | 4.29 |
| 29 | 997 | 2.82 | 1786 | 3.41 | 3412 | 3.99 | 3957 | 2.53 |
| 30 | 699 | 2.24 | 1219 | 2.75 | 2418 | 3.67 | 3749 | 2.87 |
| 31 | 1161 | 4.22 | 545 | 1.37 | 2994 | 5.63 | 1121 | 1.54 |
| 32 | 1126 | 3.69 | 1971 | 4.19 | 5980 | 6.13 | 1241 | 1.21 |
| 33 | 591 | 2.13 | 962 | 2.61 | 2024 | 3.71 | 1114 | 1.33 |
| 34 | 490 | 1.81 | 808 | 2.1 | 917 | 1.86 | 2235 | 2.33 |
| 35 | 1182 | 3.91 | 1383 | 2.97 | 2515 | 3.48 | 2294 | 1.84 |
| 36 | 1637 | 5.25 | 1341 | 2.68 | 2676 | 3.28 | 1628 | 1.5 |
| 37 | 648 | 2.17 | 996 | 2.6 | 1995 | 3.34 | 884 | 1.32 |
| 38 | 795 | 2.38 | 695 | 1.73 | 3272 | 4.49 | 1578 | 1.53 |
| 39 | 690 | 2.12 | 1810 | 3.36 | 3385 | 4.17 | 5696 | 3.34 |
| 40 | 1869 | 6.07 | 1301 | 2.22 | 3606 | 3.57 | 1084 | 1.8 |
| 41 | 1229 | 3.66 | 1419 | 3.2 | 3099 | 4.91 | 2313 | 2.97 |
| 42 | 1249 | 3.58 | 1441 | 3.11 | 3894 | 5.93 | 1187 | 1.49 |
| 43 | 770 | 2.48 | 1464 | 3.9 | 4610 | 7.08 | 929 | 1.7 |
| 44 | 867 | 3.15 | 1388 | 3.26 | 704 | 8.9 | 1720 | 1.98 |
| Record | 4-story | 8-story | 12-story | 24-story | ||||
| R-LRFD | R-ASD | R-LRFD | R-ASD | R-LRFD | R-ASD | R-LRFD | R-ASD | |
| 1 | 6.79 | 9.78 | 13.23 | 19.05 | 17.35 | 24.99 | 3.53 | 5.09 |
| 3 | 8.51 | 12.26 | 4.07 | 5.86 | 9.26 | 13.34 | 10.34 | 14.89 |
| 4 | 14.88 | 21.43 | 18.26 | 26.29 | 21.56 | 31.05 | 5.21 | 7.5 |
| 5 | 5.13 | 7.39 | 9.69 | 13.96 | 12.33 | 17.76 | 7.79 | 11.21 |
| 6 | 7.32 | 10.54 | 17.91 | 25.79 | 15.79 | 22.74 | 4.12 | 5.93 |
| 7 | 9.17 | 13.2 | 6.09 | 8.77 | 6.39 | 9.21 | 4.9 | 7.06 |
| 8 | 7.59 | 10.93 | 7.4 | 10.65 | 12.67 | 18.25 | 7.59 | 10.92 |
| 9 | 5.53 | 7.96 | 8.67 | 12.49 | 9.96 | 14.35 | 10.2 | 14.69 |
| 10 | 9.18 | 13.22 | 12.12 | 17.45 | 11.02 | 15.87 | 3.61 | 5.2 |
| 11 | 5.75 | 8.28 | 15.26 | 21.97 | 23.19 | 33.4 | 4.65 | 6.69 |
| 12 | 9.44 | 13.59 | 12.66 | 18.23 | 13.72 | 19.75 | 12.61 | 18.15 |
| 13 | 5.76 | 8.29 | 13.05 | 18.8 | 11.61 | 16.71 | 4.95 | 7.13 |
| 14 | 11.3 | 16.27 | 6 | 8.64 | 8.58 | 12.36 | 6.01 | 8.66 |
| 15 | 9.16 | 13.19 | 5.84 | 8.41 | 5.54 | 7.98 | 13.15 | 18.93 |
| 16 | 4.95 | 7.13 | 7.77 | 11.19 | 16.54 | 23.81 | 13.27 | 19.1 |
| 17 | 3.77 | 5.43 | 6.94 | 9.99 | 6.94 | 9.99 | 3.91 | 5.62 |
| 18 | 5.81 | 8.36 | 4.93 | 7.1 | 2.56 | 3.69 | 6.74 | 9.7 |
| 19 | 10.02 | 14.43 | 10.37 | 14.93 | 10.37 | 14.94 | 5.45 | 7.84 |
| 20 | 10.04 | 14.46 | 14.91 | 21.48 | 15.92 | 22.93 | 4.53 | 6.52 |
| 21 | 5.29 | 7.61 | 10.74 | 15.46 | 13.58 | 19.55 | 4.69 | 6.75 |
| 22 | 7.99 | 11.51 | 12.75 | 18.36 | 22 | 31.68 | 3.65 | 5.25 |
| 23 | 7.75 | 11.15 | 17.33 | 24.96 | 17.02 | 24.51 | 4.55 | 6.56 |
| 24 | 14.1 | 20.31 | 12.99 | 18.71 | 13.32 | 19.18 | 2.99 | 4.31 |
| 25 | 9.84 | 14.17 | 15.01 | 21.62 | 13.91 | 20.03 | 14.23 | 20.49 |
| 26 | 5.22 | 7.51 | 5.26 | 7.57 | 9.51 | 13.69 | 22.57 | 32.5 |
| 27 | 5.93 | 8.54 | 9.2 | 13.25 | 9.48 | 13.64 | 13.61 | 19.6 |
| 28 | 6.1 | 8.78 | 2.69 | 3.87 | 7.31 | 10.53 | 14.16 | 20.39 |
| 29 | 8.38 | 12.06 | 12.58 | 18.12 | 14.36 | 20.68 | 11.76 | 16.94 |
| 30 | 5.87 | 8.45 | 8.61 | 12.39 | 10.17 | 14.64 | 11.14 | 16.04 |
| 31 | 9.75 | 14.04 | 3.86 | 5.56 | 12.61 | 18.16 | 3.34 | 4.81 |
| 32 | 9.45 | 13.6 | 13.91 | 20.03 | 25.13 | 36.19 | 3.69 | 5.31 |
| 33 | 4.96 | 7.15 | 6.79 | 9.77 | 8.5 | 12.23 | 3.33 | 4.79 |
| 34 | 4.11 | 5.92 | 5.71 | 8.23 | 3.85 | 5.54 | 6.66 | 9.6 |
| 35 | 9.93 | 14.3 | 9.77 | 14.07 | 10.58 | 15.23 | 6.81 | 9.8 |
| 36 | 13.76 | 19.81 | 9.49 | 13.66 | 11.25 | 16.2 | 4.86 | 7 |
| 37 | 5.43 | 7.81 | 7.02 | 10.11 | 8.38 | 12.07 | 2.63 | 3.78 |
| 38 | 6.69 | 9.63 | 4.91 | 7.08 | 13.74 | 19.78 | 4.7 | 6.76 |
| 39 | 5.81 | 8.36 | 12.77 | 18.39 | 14.22 | 20.48 | 16.97 | 24.43 |
| 40 | 15.72 | 22.64 | 9.19 | 13.23 | 15.14 | 21.8 | 3.22 | 4.64 |
| 41 | 10.32 | 14.86 | 10.02 | 14.42 | 13.01 | 18.74 | 6.89 | 9.92 |
| 42 | 10.49 | 15.1 | 10.2 | 14.69 | 16.37 | 23.57 | 3.53 | 5.09 |
| 43 | 6.47 | 9.32 | 10.34 | 14.88 | 19.4 | 27.93 | 2.77 | 3.99 |
| 44 | 7.28 | 10.48 | 9.81 | 14.13 | 26.34 | 37.94 | 5.13 | 7.38 |
| Average | 8.06 | 11.6 | 9.91 | 14.28 | 13.19 | 18.99 | 10.73 | 15.45 |
| Standard deviation | 2.83 | 4.08 | 3.85 | 5.55 | 5.34 | 7.69 | 4.21 | 5.49 |
| Coefficient of variation | 0.35 | 0.35 | 0.39 | 0.39 | 0.4 | 0.4 | 0.39 | 0.36 |
Finally, the results of incremental dynamic analysis of structural models under 28 records near-field with pulses are presented in Tables 11 and 12. The values of the coefficient of behavior of structural models in the limit states and allowable stresses are given under the records mentioned in Table 13. In order to investigate the dispersion of the results, the coefficient of variation (CV) is calculated as it is less than 0.4, it shows that the dispersion of data is less and has a higher generality.
The results of incremental dynamic analysis of structural models under 28 records near-field without pulse are presented in Tables 14 and 15. The values of the coefficient of behavior of structural models in the limit states and allowable stresses are given under the records mentioned in Table 16. In order to examine the dispersion of the results, the coefficient of variation (CV) has been calculated at the end of Table 16; as it is less than 0.4, it shows that the dispersion of the data is less and more general.
| Record | 4-story | 8-story | 12-story | 24-story | ||||
| Failure Resistance | Over strength Coefficient | Over strength Coefficient | Over strength Coefficient | Failure Resistance | Over strength Coefficient | Failure Resistance | Over strength Coefficient | |
| 1 | 299 | 2.51 | 401 | 2.83 | 550 | 2.31 | 1262 | 3.76 |
| 2 | 287 | 2.41 | 329 | 2.32 | 551 | 2.32 | 972 | 2.89 |
| 3 | 160 | 1.34 | 419 | 2.96 | 641 | 2.69 | 948 | 2.82 |
| 4 | 276 | 2.32 | 398 | 2.81 | 585 | 2.46 | 1316 | 3.92 |
| 5 | 295 | 2.48 | 320 | 2.26 | 644 | 2.71 | 879 | 2.62 |
| 6 | 274 | 2.3 | 384 | 2.71 | 596 | 2.5 | 1232 | 3.67 |
| 7 | 219 | 1.84 | 186 | 1.31 | 598 | 2.51 | 902 | 2.68 |
| 8 | 293 | 2.46 | 376 | 2.65 | 672 | 2.82 | 853 | 2.54 |
| 9 | 301 | 2.53 | 478 | 3.37 | 708 | 2.97 | 1369 | 4.07 |
| 10 | 274 | 2.3 | 446 | 3.15 | 620 | 2.61 | 1175 | 3.5 |
| 11 | 264 | 2.22 | 439 | 3.1 | 672 | 2.82 | 1273 | 3.79 |
| 12 | 202 | 1.7 | 366 | 2.58 | 563 | 2.37 | 1173 | 3.49 |
| 13 | 328 | 2.76 | 403 | 2.84 | 630 | 2.65 | 501 | 1.49 |
| 14 | 305 | 2.56 | 458 | 3.23 | 633 | 2.66 | 1291 | 3.84 |
| 15 | 293 | 2.46 | 360 | 2.54 | 577 | 2.42 | 1254 | 3.73 |
| 16 | 363 | 3.05 | 519 | 3.66 | 735 | 3.09 | 1113 | 3.31 |
| 17 | 300 | 2.52 | 423 | 2.99 | 780 | 3.28 | 661 | 1.97 |
| 18 | 286 | 2.4 | 402 | 2.84 | 637 | 2.68 | 784 | 2.33 |
| 19 | 334 | 2.81 | 411 | 2.9 | 621 | 2.61 | 907 | 2.7 |
| 20 | 363 | 3.05 | 363 | 2.56 | 719 | 3.02 | 1167 | 3.47 |
| 21 | 150 | 1.26 | 398 | 2.81 | 569 | 2.39 | 1252 | 3.73 |
| 22 | 279 | 2.34 | 390 | 2.75 | 566 | 2.38 | 926 | 2.76 |
| 23 | 195 | 1.64 | 402 | 2.84 | 556 | 2.34 | 1093 | 3.25 |
| 24 | 113 | 0.95 | 387 | 2.73 | 587 | 2.47 | 570 | 1.7 |
| 25 | 141 | 1.18 | 210 | 1.48 | 541 | 2.27 | 1028 | 3.06 |
| 26 | 253 | 2.13 | 373 | 2.63 | 530 | 2.23 | 1089 | 3.24 |
| 27 | 271 | 2.28 | 450 | 3.18 | 662 | 2.78 | 1259 | 3.75 |
| 28 | 216 | 1.82 | 396 | 2.8 | 609 | 2.56 | 896 | 2.67 |
| Record | 4-story | 8-story | 12-story | 24-story | ||||
| Linear base shear | Ductility Coefficient | Linear base shear | Ductility Coefficient | Linear base shear | Ductility Coefficient | Linear base shear | Ductility Coefficient | |
| 1 | 855 | 2.86 | 1021 | 2.55 | 1455 | 2.65 | 3370 | 2.67 |
| 2 | 402 | 1.4 | 462 | 1.4 | 937 | 1.7 | 2435 | 2.51 |
| 3 | 171 | 1.07 | 1346 | 3.21 | 2217 | 3.46 | 1725 | 1.82 |
| 4 | 447 | 1.62 | 1047 | 2.63 | 1159 | 1.98 | 3476 | 2.64 |
| 5 | 712 | 2.41 | 379 | 1.18 | 1864 | 2.89 | 2075 | 2.36 |
| 6 | 358 | 1.31 | 802 | 2.09 | 1158 | 1.94 | 3687 | 2.99 |
| 7 | 248 | 1.13 | 239 | 1.28 | 2607 | 4.36 | 2789 | 3.09 |
| 8 | 890 | 3.04 | 1693 | 4.5 | 2313 | 3.44 | 1322 | 1.55 |
| 9 | 788 | 2.62 | 1699 | 3.55 | 3318 | 4.69 | 4998 | 3.65 |
| 10 | 491 | 1.79 | 959 | 2.15 | 2606 | 4.2 | 4152 | 3.53 |
| 11 | 563 | 2.13 | 1108 | 2.52 | 1684 | 2.51 | 5710 | 4.49 |
| 12 | 223 | 1.1 | 1002 | 2.74 | 2166 | 3.85 | 5559 | 4.74 |
| 13 | 156 | 0.48 | 827 | 2.05 | 1665 | 2.64 | 573 | 1.14 |
| 14 | 817 | 2.68 | 1157 | 2.53 | 1664 | 2.63 | 5044 | 3.91 |
| 15 | 485 | 1.66 | 679 | 1.89 | 1084 | 1.88 | 2670 | 2.13 |
| 16 | 1206 | 3.32 | 1225 | 2.36 | 2329 | 3.17 | 3058 | 2.75 |
| 17 | 662 | 2.21 | 1611 | 3.81 | 4792 | 6.14 | 922 | 1.39 |
| 18 | 764 | 2.67 | 1446 | 3.6 | 2567 | 4.03 | 1099 | 1.4 |
| 19 | 1206 | 3.61 | 1422 | 3.46 | 1174 | 1.89 | 1350 | 1.49 |
| 20 | 1148 | 3.16 | 615 | 1.69 | 3449 | 4.8 | 2990 | 2.56 |
| 21 | 165 | 1.1 | 549 | 1.38 | 1171 | 2.06 | 4307 | 3.44 |
| 22 | 586 | 2.1 | 884 | 2.27 | 3065 | 5.42 | 2634 | 2.84 |
| 23 | 221 | 1.13 | 1244 | 3.09 | 2704 | 4.86 | 2600 | 2.38 |
| 24 | 127 | 1.12 | 1400 | 3.62 | 2212 | 3.77 | 1062 | 1.86 |
| 25 | 163 | 1.16 | 412 | 1.96 | 1056 | 1.95 | 2887 | 2.81 |
| 26 | 249 | 0.98 | 495 | 1.33 | 1198 | 2.26 | 2991 | 2.75 |
| 27 | 902 | 3.33 | 1186 | 2.64 | 2048 | 3.09 | 4450 | 3.53 |
| 28 | 247 | 1.14 | 1180 | 2.98 | 2028 | 3.33 | 1835 | 2.05 |
| Record | 4-story | 8-story | 12-story | 24-story | ||||
| R-LRFD | R-ASD | R-LRFD | R-ASD | R-LRFD | R-ASD | R-LRFD | R-ASD | |
| 1 | 7.18 | 10.34 | 7.21 | 10.38 | 6.11 | 8.8 | 10.03 | 14.44 |
| 2 | 3.38 | 4.87 | 3.26 | 4.69 | 3.94 | 5.67 | 7.25 | 10.44 |
| 3 | 1.44 | 2.07 | 9.5 | 13.68 | 9.32 | 13.41 | 5.13 | 7.39 |
| 4 | 3.76 | 5.41 | 7.39 | 10.64 | 4.87 | 7.01 | 10.35 | 14.9 |
| 5 | 5.98 | 8.61 | 2.68 | 3.86 | 7.83 | 11.28 | 6.18 | 8.89 |
| 6 | 3.01 | 4.33 | 5.66 | 8.15 | 4.87 | 7.01 | 10.97 | 15.8 |
| 7 | 2.08 | 3 | 1.69 | 2.43 | 10.94 | 15.75 | 8.3 | 11.95 |
| 8 | 7.48 | 10.77 | 11.95 | 17.21 | 9.72 | 13.99 | 3.93 | 5.67 |
| 9 | 6.62 | 9.53 | 11.99 | 17.27 | 13.94 | 20.08 | 14.88 | 21.42 |
| 10 | 4.13 | 5.95 | 6.77 | 9.75 | 10.95 | 15.77 | 12.36 | 17.79 |
| 11 | 4.73 | 6.81 | 7.82 | 11.26 | 7.08 | 10.19 | 17.02 | 24.51 |
| 12 | 1.87 | 2.69 | 7.07 | 10.18 | 9.1 | 13.11 | 16.54 | 23.82 |
| 13 | 1.31 | 1.89 | 5.84 | 8.41 | 7 | 10.07 | 1.71 | 2.46 |
| 14 | 6.87 | 9.89 | 8.17 | 11.76 | 6.99 | 10.07 | 15.01 | 21.62 |
| 15 | 4.08 | 5.88 | 4.79 | 6.9 | 4.55 | 6.56 | 7.95 | 11.44 |
| 16 | 10.13 | 14.59 | 8.65 | 12.46 | 9.79 | 14.09 | 9.1 | 13.11 |
| 17 | 5.56 | 8.01 | 11.37 | 16.37 | 20.13 | 28.99 | 2.74 | 3.95 |
| 18 | 6.42 | 9.24 | 10.21 | 14.7 | 10.79 | 15.53 | 3.27 | 4.71 |
| 19 | 10.13 | 14.59 | 10.04 | 14.46 | 4.93 | 7.1 | 4.02 | 5.79 |
| 20 | 9.65 | 13.9 | 4.34 | 6.25 | 14.49 | 20.87 | 8.9 | 12.81 |
| 21 | 1.39 | 2 | 3.88 | 5.59 | 4.92 | 7.09 | 12.82 | 18.46 |
| 22 | 4.92 | 7.08 | 6.24 | 8.99 | 12.89 | 18.56 | 7.84 | 11.29 |
| 23 | 1.86 | 2.68 | 8.78 | 12.64 | 11.36 | 16.36 | 7.74 | 11.14 |
| 24 | 1.07 | 1.54 | 9.88 | 14.23 | 9.29 | 13.38 | 3.16 | 4.55 |
| 25 | 1.37 | 1.97 | 2.91 | 4.19 | 4.44 | 6.39 | 8.59 | 12.37 |
| 26 | 2.09 | 3.01 | 3.49 | 5.03 | 5.03 | 7.25 | 8.9 | 12.82 |
| 27 | 7.58 | 10.92 | 8.37 | 12.05 | 8.61 | 12.39 | 13.24 | 19.07 |
| 28 | 2.08 | 3 | 8.33 | 12 | 8.52 | 12.27 | 5.46 | 7.86 |
| Average | 6.58 | 9.48 | 8.08 | 11.64 | 8.66 | 12.47 | 9.69 | 13.95 |
| Standard deviation | 2.6 | 3.03 | 2.86 | 4.12 | 3.28 | 5.3 | 3.4 | 5.04 |
| Coefficient of variation | 0.39 | 0.32 | 0.35 | 0.35 | 0.38 | 0.42 | 0.35 | 0.36 |
Table 14.
| Record | 4-story | 8-story | 12-story | 24-story | ||||
| Failure | Over strength Coefficient | Failure Resistance | Over strength Coefficient | Failure Resistance | Over strength Coefficient | Failure Resistance | Over strength Coefficient | |
| Resistance | ||||||||
| 1 | 249 | 2.09 | 480 | 3.39 | 591 | 2.48 | 851 | 2.53 |
| 2 | 308 | 2.59 | 442 | 3.12 | 682 | 2.87 | 884 | 2.63 |
| 3 | 255 | 2.14 | 443 | 3.13 | 810 | 3.4 | 1239 | 3.69 |
| 4 | 300 | 2.52 | 476 | 3.36 | 887 | 3.73 | 606 | 1.8 |
| 5 | 318 | 2.67 | 452 | 3.19 | 675 | 2.84 | 1042 | 3.1 |
| 6 | 273 | 2.29 | 451 | 3.18 | 676 | 2.84 | 689 | 2.05 |
| 7 | 382 | 3.21 | 633 | 4.47 | 958 | 4.03 | 1389 | 4.13 |
| 8 | 334 | 2.81 | 502 | 3.54 | 768 | 3.23 | 1378 | 4.1 |
| 9 | 318 | 2.67 | 560 | 3.95 | 783 | 3.29 | 1464 | 4.36 |
| 10 | 326 | 2.74 | 500 | 3.53 | 778 | 3.27 | 1409 | 4.19 |
| 11 | 216 | 1.82 | 484 | 3.42 | 730 | 3.07 | 1105 | 3.29 |
| 12 | 256 | 2.15 | 458 | 3.23 | 780 | 3.28 | 1196 | 3.56 |
| 13 | 303 | 2.55 | 525 | 3.71 | 797 | 3.35 | 1292 | 3.85 |
| 14 | 190 | 1.6 | 488 | 3.44 | 725 | 3.05 | 893 | 2.66 |
| 15 | 288 | 2.42 | 448 | 3.16 | 667 | 2.8 | 1382 | 4.11 |
| 16 | 320 | 2.69 | 521 | 3.68 | 769 | 3.23 | 1452 | 4.32 |
| 17 | 261 | 2.19 | 438 | 3.09 | 723 | 3.04 | 884 | 2.63 |
| 18 | 288 | 2.42 | 522 | 3.68 | 783 | 3.29 | 1193 | 3.55 |
| 19 | 278 | 2.34 | 442 | 3.12 | 681 | 2.86 | 598 | 1.78 |
| 20 | 298 | 2.5 | 426 | 3.01 | 687 | 2.89 | 832 | 2.48 |
| 21 | 276 | 2.32 | 390 | 2.75 | 569 | 2.39 | 1043 | 3.1 |
| 22 | 253 | 2.13 | 372 | 2.63 | 564 | 2.37 | 1238 | 3.68 |
| 23 | 283 | 2.38 | 363 | 2.56 | 600 | 2.52 | 761 | 2.26 |
| 24 | 277 | 2.33 | 434 | 3.06 | 653 | 2.74 | 862 | 2.57 |
| 25 | 207 | 1.74 | 431 | 3.04 | 660 | 2.77 | 752 | 2.24 |
| 26 | 274 | 2.3 | 390 | 2.75 | 626 | 2.63 | 874 | 2.6 |
| 27 | 285 | 2.39 | 370 | 2.61 | 557 | 2.34 | 1230 | 3.66 |
| 28 | 275 | 2.31 | 365 | 2.58 | 599 | 2.52 | 1130 | 3.36 |
| Record | 4-story | 8-story | 12-story | 24-story | ||||
| Linear base shear | Ductility Coefficient | Linear base shear | Ductility Coefficient | Linear base shear | Ductility Coefficient | Linear base shear | Ductility Coefficient | |
| 1 | 411 | 1.65 | 2367 | 4.93 | 3667 | 6.2 | 1989 | 2.34 |
| 2 | 1110 | 3.6 | 918 | 2.08 | 2250 | 3.3 | 3341 | 3.78 |
| 3 | 766 | 3 | 1074 | 2.42 | 3682 | 4.55 | 5070 | 4.09 |
| 4 | 1297 | 4.32 | 2125 | 4.46 | 3603 | 4.06 | 1092 | 1.8 |
| 5 | 1111 | 3.49 | 1453 | 3.21 | 2354 | 3.49 | 2354 | 2.26 |
| 6 | 1245 | 4.56 | 2103 | 4.66 | 3181 | 4.71 | 970 | 1.41 |
| 7 | 1483 | 3.88 | 1953 | 3.09 | 2648 | 2.76 | 2800 | 2.02 |
| 8 | 1273 | 3.81 | 1404 | 2.8 | 2219 | 2.89 | 3895 | 2.83 |
| 9 | 1493 | 4.69 | 1233 | 2.2 | 2104 | 2.69 | 5229 | 3.57 |
| 10 | 1148 | 3.52 | 1494 | 2.99 | 2824 | 3.63 | 4317 | 3.06 |
| 11 | 283 | 1.31 | 2020 | 4.17 | 4081 | 5.59 | 1410 | 1.28 |
| 12 | 586 | 2.29 | 1860 | 4.06 | 3346 | 4.29 | 1527 | 1.28 |
| 13 | 1115 | 3.68 | 1276 | 2.43 | 2646 | 3.32 | 2033 | 1.57 |
| 14 | 213 | 1.12 | 1618 | 3.32 | 2659 | 3.67 | 1263 | 1.41 |
| 15 | 871 | 3.02 | 1529 | 3.41 | 2803 | 4.2 | 4922 | 3.56 |
| 16 | 1191 | 3.72 | 1192 | 2.29 | 2365 | 3.08 | 4423 | 3.05 |
| 17 | 435 | 1.67 | 1947 | 4.45 | 3770 | 5.21 | 860 | 0.97 |
| 18 | 938 | 3.26 | 965 | 1.85 | 2153 | 2.75 | 1891 | 1.59 |
| 19 | 475 | 1.71 | 2205 | 4.99 | 4777 | 7.01 | 900 | 1.51 |
| 20 | 924 | 3.1 | 1913 | 4.49 | 4028 | 5.86 | 1248 | 1.5 |
| 21 | 688 | 2.49 | 665 | 1.71 | 1138 | 2 | 1658 | 1.59 |
| 22 | 303 | 1.2 | 809 | 2.17 | 1320 | 2.34 | 3983 | 3.22 |
| 23 | 555 | 1.96 | 675 | 1.86 | 2439 | 4.07 | 1022 | 1.34 |
| 24 | 440 | 1.59 | 1282 | 2.95 | 2932 | 4.49 | 2184 | 2.53 |
| 25 | 269 | 1.3 | 1906 | 4.42 | 4776 | 7.24 | 1473 | 1.96 |
| 26 | 1014 | 3.7 | 1828 | 4.69 | 4000 | 6.39 | 972 | 1.11 |
| 27 | 470 | 1.65 | 1186 | 3.21 | 2450 | 4.4 | 5489 | 4.46 |
| 28 | 351 | 1.28 | 554 | 1.52 | 1806 | 3.02 | 4141 | 3.66 |
| Record | 4-story | 8-story | 12-story | 24-story | ||||
| R-LRFD | R-ASD | R-LRFD | R-ASD | R-LRFD | R-ASD | R-LRFD | R-ASD | |
| 1 | 3.45 | 4.97 | 16.71 | 24.06 | 15.41 | 22.19 | 5.92 | 8.52 |
| 2 | 9.33 | 13.43 | 6.48 | 9.33 | 9.45 | 13.61 | 9.94 | 14.32 |
| 3 | 6.44 | 9.27 | 7.58 | 10.92 | 15.47 | 22.28 | 15.09 | 21.73 |
| 4 | 10.9 | 15.69 | 15 | 21.6 | 15.14 | 21.8 | 3.25 | 4.68 |
| 5 | 9.34 | 13.44 | 10.26 | 14.77 | 9.89 | 14.24 | 7.01 | 10.09 |
| 6 | 10.46 | 15.07 | 14.85 | 21.38 | 13.37 | 19.25 | 2.89 | 4.16 |
| 7 | 12.46 | 17.95 | 13.79 | 19.85 | 11.13 | 16.02 | 8.33 | 12 |
| 8 | 10.7 | 15.4 | 9.91 | 14.27 | 9.32 | 13.43 | 11.59 | 16.69 |
| 9 | 12.55 | 18.07 | 8.7 | 12.53 | 8.84 | 12.73 | 15.56 | 22.41 |
| 10 | 9.65 | 13.89 | 10.55 | 15.19 | 11.87 | 17.09 | 12.85 | 18.5 |
| 11 | 2.38 | 3.42 | 10.84 | 15.61 | 17.16 | 24.71 | 4.2 | 6.04 |
| 12 | 4.92 | 7.09 | 13.13 | 18.91 | 14.06 | 20.24 | 4.54 | 6.54 |
| 13 | 9.37 | 13.49 | 9.01 | 12.97 | 11.12 | 16.01 | 6.05 | 8.71 |
| 14 | 1.79 | 2.58 | 11.42 | 16.45 | 11.17 | 16.09 | 3.76 | 5.41 |
| 15 | 7.32 | 10.54 | 10.79 | 15.54 | 11.78 | 16.96 | 14.65 | 21.09 |
| 16 | 10.01 | 14.41 | 8.41 | 12.12 | 9.94 | 14.31 | 13.16 | 18.96 |
| 17 | 3.66 | 5.26 | 13.74 | 19.79 | 15.84 | 22.81 | 2.56 | 3.69 |
| 18 | 7.88 | 11.35 | 6.81 | 9.81 | 9.05 | 13.03 | 5.63 | 8.1 |
| 19 | 3.99 | 5.75 | 15.57 | 22.41 | 20.07 | 28.9 | 2.68 | 3.86 |
| 20 | 7.76 | 11.18 | 13.5 | 19.45 | 16.92 | 24.37 | 3.71 | 5.35 |
| 21 | 5.78 | 8.33 | 4.69 | 6.76 | 4.78 | 6.89 | 4.93 | 7.11 |
| 22 | 2.55 | 3.67 | 5.71 | 8.22 | 5.55 | 7.99 | 11.85 | 17.07 |
| 23 | 4.66 | 6.72 | 4.76 | 6.86 | 10.25 | 14.76 | 3.04 | 4.38 |
| 24 | 3.7 | 5.32 | 9.05 | 13.03 | 12.32 | 17.74 | 6.5 | 9.36 |
| 25 | 2.26 | 3.26 | 13.44 | 19.35 | 20.05 | 28.88 | 4.38 | 6.31 |
| 26 | 8.52 | 12.27 | 12.9 | 18.58 | 16.81 | 24.2 | 2.89 | 4.17 |
| 27 | 3.95 | 5.69 | 8.37 | 12.06 | 10.29 | 14.82 | 16.34 | 23.52 |
| 28 | 2.95 | 4.25 | 3.91 | 5.63 | 7.59 | 10.93 | 12.32 | 17.75 |
| Average | 6.74 | 9.71 | 10.35 | 14.91 | 12.31 | 17.72 | 7.7 | 11.09 |
| Standard deviation | 2.32 | 3.77 | 3.5 | 5.04 | 3.86 | 5.57 | 2.55 | 4.55 |
| Coefficient of variation | 0.34 | 0.39 | 0.34 | 0.34 | 0.31 | 0.31 | 0.33 | 0.41 |
7. RESULTS AND DISCUSSION
By summarizing the results of the analyses, the values of the coefficient of behavior of structural models in the limit states and allowable stresses are given in Table 17.
| Record | 4-story | 8-story | 12-story | 24-story | ||||
| R-LRFD | R-ASD | R-LRFD | R-ASD | R-LRFD | R-ASD | R-LRFD | R-ASD | |
| Far-field | 8.06 | 11.6 | 9.91 | 14.28 | 13.19 | 18.99 | 7.13 | 10.27 |
| Near-field with pulse | 4.58 | 6.59 | 7.08 | 10.2 | 8.66 | 12.47 | 8.69 | 12.52 |
| Near-field without pulse | 6.74 | 9.71 | 10.35 | 14.91 | 12.31 | 17.72 | 7.7 | 11.09 |
| Average | 6.46 | 9.3 | 9.11 | 13.13 | 11.39 | 16.39 | 7.84 | 11.29 |
From Table 17, the following results can be deduced:
In far-field records, the values of behavior coefficient increase with the increasing number of stories in the range of low and mid-rise structures. Meanwhile, in the near-field with pulse records, there is an incremental trend for all structures, including low, mid, and high-rise structures, and in the case of near-field without pulse records, such as the far-field, we have an incremental trend except for the high-rise structure.
For low-rise structures, numerical values of the coefficient of behavior are less than mid-rise structures. In general, the average coefficient of behavior in the states of limit and allowable stress is calculated equal to 8.70 and 12.50, respectively. The more records used in the analysis, the more valid the results of the analysis. In this study, due to the significant number of records, the reliability of the results is high.
The proposed value of behavior coefficient according to ASCE07-2010 regulation for the researched system is 8, which according to the results of this research (Table 17) is for structures other than low-rise structures in the direction of reliability.
CONCLUSION
Due to the importance of using steel plate shear wall in the design of existing reinforced concrete frames, in this research, reinforced concrete frame structures equipped with steel plate shear wall are modeled and performed by a relatively large number of nonlinear dynamic analyses under near-field and far-field records. According to the near and far-field recommended by FEMA-P695, and the method provided by the mentioned regulation, the results show the coefficient of behavior of reinforced concrete frame system equipped with steel shear plate wall as equal to 8.7, which is 8.75% more than the proposed value of ASCE07-2010, which is 8.
LIST OF ABBREVIATIONS
| SPSW | = Steel Plate Shear Wall |
| IDA | = Incremental Dynamic Analysis |
CONSENT FOR PUBLICATION
Not applicable.
AVAILABILITY OF DATA AND MATERIALS
Implementation of the numerical part of this study was undertaken using OpenSees software. All developed codes and models supporting the findings of this study are available from the corresponding author upon [H.R] reasonable request.
FUNDING
None.
CONFLICT OF INTEREST
The authors declare no conflict of interest, financial or otherwise.
ACKNOWLEDGEMENTS
Declared none.

