All published articles of this journal are available on ScienceDirect.

Assessing the Hydraulic Performance of Innovative Circular Spillway Inlet Shapes
Authors Info & Affiliations
Abstract
Background:
In terms of the significance of spillways on dams' stability, this research was initiated to propose innovative spillway inlet shapes with the CS “Circular Spillway” and assess their hydraulic performance experimentally. Primarily, previous studies in the field of CSs were accumulated and investigated. Innovative spillway shapes with triangular or rectangular edge notches were proposed.
Methods:
A model was constructed, and 140 experiments were carried out on the proposed spillway, where the model was initially calibrated. The entrance shapes were replaced, and their impact on the COD “Coefficient of Discharge” was determined. For comparison purposes, a reference case without notches was investigated. Measurements were undertaken; analyzed, and 2 empirical eqs. were established.
Results:
The results flagged that the most reasonable inlet shape was the triangular shape, which improved COD by 143.1% relative to the reference case. Accordingly, the research acknowledged the triangular notches rather than rectangular ones.
Conclusion:
Consequently, the research recommended their implementation. Moreover, the research accredited the established eqs. to assist engineers during spillway design.
1. INTRODUCTION
Spillways are employed at the end of irrigation channels and reservoirs of dams. They are leading indicators of COD increment, where COD increment is accredited to their inlet geometric characteristics. However, orifice flow in circular spillways impairs discharge, COD, and spillway performance. Accordingly, CS is a reasonable alternative that discharges flood water into small dams' reservoirs.
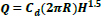
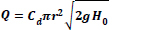
Due to the significance of spillways, many researchers were involved in investigating them worldwide, among them, for example, Afshar et al. favored earth dams, as their spillways are separated from the dam structure and are located inside their reservoirs [1]. Likewise, Mussalli designated the crest as a conical transition, vertical shaft, or bend, where it is an outlet tunnel to produce the spillway. He further stated that there are 3 cases of discharge measurement in the CSs, each depending on the water head, where the flow falls freely. It is referred to as “crest-regulated flow” in case of water level declination over the spillway crest. However, he further documented that water level increase causes spillway submergence, where it acts as an orifice [2]. On the contrary, USBR mentioned that if the spillway is completely immersed at a high water level, the flow will be under pressure (i.e., tunneling or pipe control) [3]. Similarly, Bagheri et al. advocated that the discharge through CS is calculated by Eqs. 1 and 2 for the cases of free flow and orifice flow, respectively [4].
 |
(1) |
 |
(2) |
Where:
Q: discharge of CS
Cd: COD
R: crest radius
R: radius of the conical transition
H:: water level over the spillway crest
H0: distance between the water level and the entrance to the diameter of the conical transition
g: acceleration due to gravity
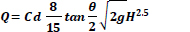
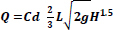
Moreover, Sommerfeld J. T et al. reported triangular and rectangular weir eqs. to estimate the out-flow, eqs. (3) and (4), respectively [5].
 |
(3) |
 |
(4) |
Where:
H: height of water above the notch
G: acceleration due to gravity
Ɵ: inclination angle of the triangular weir side
L: rectangular weir width
However, Bagheri et al. described the hydraulic properties of CSs, where their intake vortices have been subjected to theoretical and experimental studies in the last 50 years. They created physical models of MGSs “Morning-Glory-Spillway” (i.e., a type of CS) and conducted 180 experiments. They examined the impacts of polyhedral-spillway-crest on discharge intensity passing through the spillway and its CODs. They analyzed their results, which showed that the polyhedral-spillway-crest increased the COD and increased the discharge [4]. Likewise, Fattor, Claudio A., et al. scrutinized the flow states in MGS, which proved that if the water conveying the tube is not aerated, the turbulent flow will exist at its spillway, especially when it is submerged. Similarly [6], Nohani E. et al. investigated the impact of whirlpool break blade thickness on COD of the MGS. They carried out laboratory tests and constructed a physical model, where the obvious was that higher blade number and thickness improved the discharge capacity [7]. Moreover, Nohani E. et al. suggested that COD increases as spillway plate angular alignment is reduced. They further mentioned that the 5 anti-T vortex plates at 60o provided higher COD [8]. Whereas Ellesty et al. concluded that length, height, blade thickness, and orientation affect whirlpool control, longer blades have a more tangible impact than their number [9].
On the other hand, Sayadzadeh, Farzaneh et al. determined how the pyramidal vortex breaker number and shape affect COD. They established an MGS, where their results were contrasted against typical MGS. They designated that 6-vortex breakers increased their Performance Index by 50.97% and 16.13% in the crest and orifice control, respectively [10]. Moreover, Kasholi H. et al. considered vortex shapes and stepped-chamber on spillway flow. They further evaluated the pressure parameters and the spillway surface flow velocity at many sites regarding spillway discharge [11].
However, S. Habib Musavi-Jahromi et al. carried out 170 experiments to investigate the impact of angles of vortices breakers created on a spillway model on COD increment. Their results revealed that 6 vortices breakers in 45o are a reasonable arrangement [12]. Furthermore, Christodoulou et al. investigated the impact of piers on MGS discharge. They accredited that crest breakers effectively counter vortices impact [13]. Moreover, Kamanbedast et al. constructed 2 spillway models with squared and circular cross-sections. They conducted experiments under free flow to inspect the vortex breaker angle impact on COD. Their Analysis revealed that 12 vortices breakers affect COD in squared MGS [14].
Similarly, Kashkoli et al. investigated the impact of guide piers on MGS hydraulic behavior. They concluded that COD increases when piers are implemented [15]. Moreover, Shemshi and Kabiri inspected swirling flow at VSS “Vertical Shaft Spillway” with CPK “Circular Piano-Key” intake. Their results indicated that CPK swirling flow strength is lower than the case of simple-shaft spillways [16].
On the other hand, Alfatlawi and Alshakli predicted COD of stepped MGS. Their results indicated that the COD of stepped MGS decreased by increasing the head-to--toe-length and head-to-radius ratio [17].
Similarly, Nouroozi S. and Ahadiyan J. implemented Flow-3D to model the impact of the breaker blade on MGS. Their results were contrasted with experimental results. Their results indicated that blades increased COD by 42%, rather than the U.S.L “Up-Stream-Level,” which was lowered by 25%. They also designated that the 6-blade model provided the most reasonable results among the different 3-blade model arrangements [18].
Likewise, Rouzegar et al. provided a hydraulic design with a squared and circular inlets. They implemented an analytical approach for Labyrinth MGS and a model. The experimental results analysis indicated the effect of zigzag length on COD that was greater in the squared inlets than in the circular one [19].
Similarly, Kabiri-Samani A. and Keihanpour M. investigated the marguerite-inlet hydraulic performance as a vertical shaft spillway. Their results indicated that Marguerite-inlets increased the crest length by 6 folds of the original shaft spillway [20].
2. MATERIALS AND METHODS
2.1. Dimensional Analysis
A dimensional analysis was carried out. The parameters affecting COD of the circular spillway, in terms of the geometric characteristics, are described as follows:
 |
(5) |
Where:
Cd: COD of circular spillway
ρ: density (ML-3)
µ: dynamic-viscosity (ML-1T-1)
g: acceleration due to gravity (LT-2)
V: velocity (LT-1)
HC: water level above the spillway crest (L)
Hn: head above the weir edge (L)
D: crest-diameter (L)
d: Spillway Throat diameter (L)
Pc and Pn: crest perimeter of spillway crest and notches edge, respectively (L)
Sn: coefficient denoted notch shape.
n: number of notches
According to Buckingham's Theory, 9 variables should have 3 dimensions M, L, and T. The dimensionless eqs. equal the number of variables subtracted from the number of dimensions, as shown in Table 1.
| Л NO | Л -Terms | Dimensionless Analysis | Equation Number |
|---|---|---|---|
| π1 | va1 ρb1 Dc1 µ | µ/ρvDc = 1/Re | 6 |
| π2 | va1 ρb1 Dc1 d | d/Dc | 7 |
| π3 | va1 ρb1 Dc1 Hc | Hc/Dc | 8 |
| π4 | va1 ρb1 Dc1 Hn | Hn/Dc | 9 |
| π5 | va1 ρb1 Dc1 Pc | Pc/ Dc | 10 |
| π6 | va1 ρb1 Dc1 Pn | Pn/ Dc | 11 |
| π7 | va1 ρb1 Dc1 g | gDc/v2= (1/Fr2) | 12 |
| π8 | Sn | Sn | 13 |
| π9 | n | N | 14 |
By multiplying or dividing 2 dimensionless eqs., a dimensionless equation is obtained. Accordingly, by dividing the 3rd over the 5th and by dividing the 4th over the 6th, dimensionless eqs. are obtained, which are as follows:
 |
(15) |
 |
(16) |
According to Buckingham π-theorem, the relationship between the variables is described as follows:
 |
(17) |
According to Sayadzadeh, Farzaneh, et al., the similar dimensions of the notches make the impact of Weber and Reynolds numbers minimal on the flow, so they were neglected [21].
2.2. Experimental Work
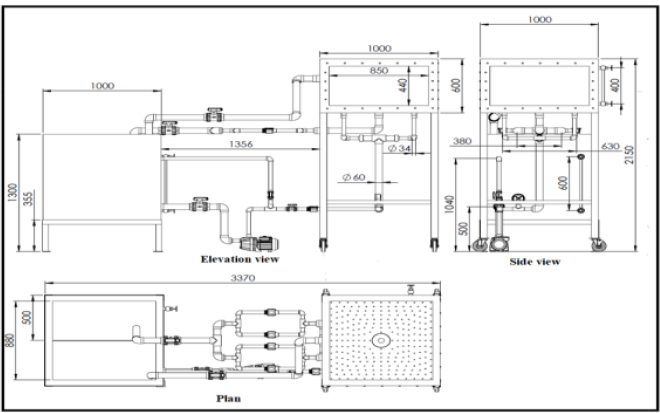
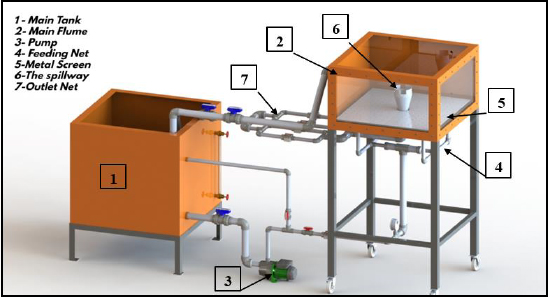
The experimental work was carried out in the Faculty of Engineering, Al-Azhar University-Cairo, in the Irrigation and Hydraulics Laboratory, where a physical apparatus was constructed; (Figs. 1 and 2).
2.2.1. Describing the Constructed Experimental Apparatus
The experimental apparatus encompasses the following parts:
• Main tank: Its dimensions are 100x100x100 cm3. It acts as a water source. It has 2 vents, one for calibration and the other for volume measurement.
• Reservoir: It is a tank that contains the spillway. It is 100x100x60 cm3. The tank sidewalls are 8 mm Plexiglas. The fore- and rear- sides, as the bottom, are of steel. Steel angles anchor them to resist water pressure.
• Pump: Its capacity is 1.3 hp, and its pumping rate is 100 l/min.
• Feeding network: It is of plastic pipe with a 1-inch diameter.
• Metal mesh or metal screen: It is used to calm the water.
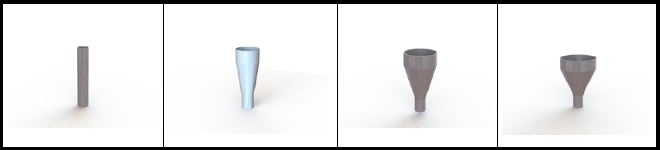
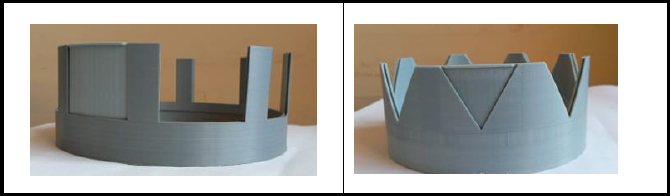
• Spillway miniatures: They consist of a fixed part, a cylindrical pipe or a funnel-shaped pipe and a replaceable part that should be fitted to it.
• Drainage network: It has 2-inch diameter pipes and four gauges to measure the flow rate.
2.2.2. Fabricating the Proposed Spillways
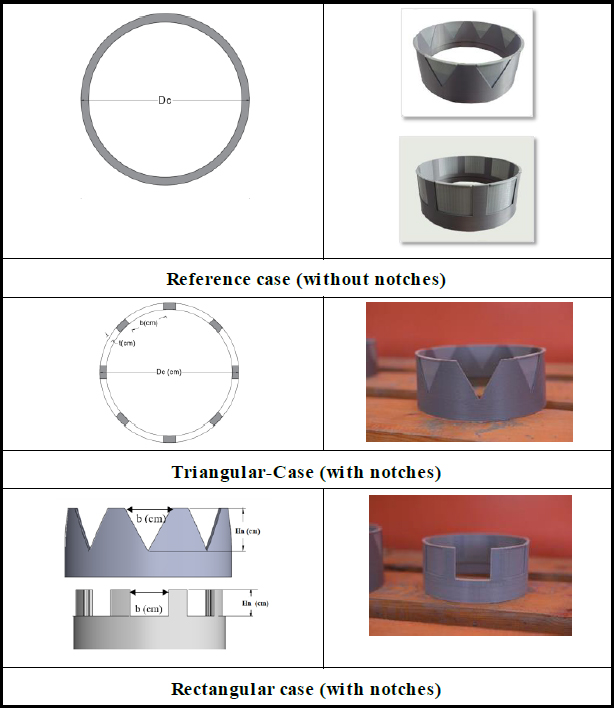
The proposed spillways were fabricated by 3D printing. Their 4 mm steel fixed part was with diameters of 2, 4, 6, and 8 inches, whereas their reinforced plastic replaceable part (i.e., crest) was with the dimensions presented in Figs. (3 and 4), respectively. However, (Fig. 5 and Table 2) are provided to describe the replaceable parts. These are circular notches, rectangular, and triangular with notches (i.e., Reference-Case, Rectangular-Case, and Triangular-Case, respectively).
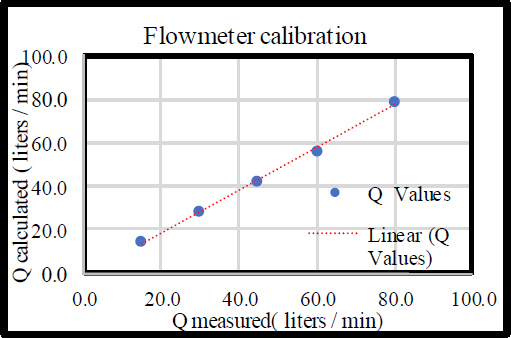
2.2.3. Calibrating the Measuring Devices
The measuring devices were calibrated based on the continuity equation, which is described as follows
 |
(18) |
Where: Qin: in-flow, Qout: out-flow
This was achieved by measuring the discharge by collecting a certain volume within a specific time. This was realized by a piezometer that measured differential water height changes within 30 sec, during which the measured discharge “Q measured” was obtained.
On the other hand, the discharge was calculated “Qcalculated” based on the flow meter reading.
Accordingly, a relationship between Q measured and Q calculated was obtained and presented in Fig. (6), from which apparent was their concurrency.
| Case |
Hn (cm) |
t (mm) |
Dc (cm) |
Rectangular (R2, R4, R8) | Triangular (T2, T4, T8) | |||||||
|---|---|---|---|---|---|---|---|---|---|---|---|---|
| B (cm) |
h (cm) |
b/D | h/D | b (cm) |
h (cm) |
b/D | h/D | Ɵ (degree) |
||||
| D =2 | 1.40 | 5 | 6.3 | 1.62 | 1.403 | 0.253 | 0.219 | 1.62 | 1.403 | 0.253 | 0.219 | 60 |
| D= 4 | 2.49 | 4 | 10.7 | 2.886 | 2.499 | 0.269 | 0.233 | 2.886 | 2.499 | 0.269 | 0.233 | 60 |
| D =6 | 3.83 | 4 | 15.8 | 4.388 | 3.833 | 0.277 | 0.242 | 4.388 | 3.833 | 0.277 | 0.242 | 60 |
| D4=8 | 5.06 | 4 | 20.8 | 5.85 | 5.066 | 0.281 | 0.243 | 5.85 | 5.066 | 0.281 | 0.243 | 60 |
| Run Number | Spillway Diameter | Discharge | Spillway Type | Number of Notches | Run Code |
|---|---|---|---|---|---|
| 1 | 2 | Q1 | Circular | - | RD1,Q1,C,- |
| 2 | Rectangular | 2 | R D1,Q1,R,2 | ||
| 3 | 4 | R D1,Q1,R,4 | |||
| 4 | 8 | R D1,Q1,R,8 | |||
| 5 | Triangular | 2 | R D1,Q1,T,2 | ||
| 6 | 4 | R D1,Q1,T,4 | |||
| 7 | 8 | R D1,Q1,T,8 |
2.2.4. Executing Experiments After the Experimental Program
With confidence in the calibration process, experiments were carried out based on an established experimental program that varied in the contributing parameters as follows:
• Spillway diameter “D” (i.e., D1=2, D2=4, D3=6, and D4=8 inch)
• Spillway shape “S” (i.e., S=C=circular, S=R=rectangular, and S=T=triangular)
• Number of notches “n” (i.e., n=2, n=4, and n=8)
• Discharge”Q” (i.e., Q1=15, Q2=30, Q3=45, Q4=60 and Q5=80).
Tables 3-7 designates the experimental program, where the table encompasses the experiments for the case of testing a specific diameter D1=2 inches at the discharges Q1. The table holds 7 experiments, where the runs were coded according to the implemented spillway diameter “D,” discharge “Q,” spillway shape “S,” and the number of notches “n” (RD, Q, S,n). Accordingly, RD1, Q1, R,2 denotes the run with a spillway diameter = D1, discharge = Q1, spillway type = rectangular, and the number of notches = 2.
| Triangular Notch | Qr |
COD (Dr1, C) |
COD (Dr1,T2) |
COD Increment % |
COD (Dr1,T4) |
COD Increment % |
COD (Dr1,T8) |
COD Increment % |
|---|---|---|---|---|---|---|---|---|
| 0.6899 | 0.713 | 0.714 | 0.057 | 0.715 | 0.285 | 0.721 | 1.122 | |
| 0.492 | 0.573 | 0.931 | 62.477 | 0.936 | 63.193 | 0.955 | 66.648 | |
| 0.369 | 0.852 | 0.863 | 1.318 | 0.909 | 6.656 | 0.933 | 9.433 | |
| 0.246 | 0.842 | 0.854 | 1.420 | 0.881 | 4.668 | 0.916 | 8.750 | |
| 0.123 | 0.688 | 0.806 | 17.049 | 0.856 | 24.317 | 0.885 | 28.559 | |
| Rectangular Notch | Qr |
COD (Dr1, C) |
COD (Dr1,R2) |
COD Increment % |
COD (Dr1,R4) |
COD Increment % |
COD (Dr1, R8) |
COD Increment % |
| 0.6899 | 0.713 | 0.735 | 3.097 | 0.745 | 4.482 | 0.958 | 34.405 | |
| 0.492 | 0.573 | 0.896 | 56.37 | 0.901 | 57.103 | 0.929 | 62.105 | |
| 0.369 | 0.852 | 0.865 | 1.450 | 0.893 | 4.819 | 0.914 | 7.270 | |
| 0.246 | 0.842 | 0.857 | 1.788 | 0.885 | 5.132 | 0.904 | 7.381 | |
| 0.123 | 0.688 | 0.772 | 12.117 | 0.830 | 20.627 | 0.867 | 25.984 |
| Triangular Notch | Qr |
COD (Dr2,C) |
COD (Dr2,T2) |
COD Increment % |
COD (Dr2,T4) |
COD Increment % |
COD (Dr2,T8) |
COD Increment % |
|---|---|---|---|---|---|---|---|---|
| 0.6899 | 0.899 | 0.913 | 1.527 | 0.930 | 3.408 | 0.940 | 4.516 | |
| 0.492 | 0.873 | 0.876 | 0.339 | 0.898 | 2.883 | 0.903 | 3.378 | |
| 0.369 | 0.704 | 0.856 | 21.535 | 0.886 | 25.801 | 0.886 | 25.908 | |
| 0.246 | 0.680 | 0.837 | 23.102 | 0.878 | 29.257 | 0.881 | 29.624 | |
| 0.123 | 0.664 | 0.825 | 24.321 | 0.837 | 26.112 | 0.869 | 30.874 | |
| Rectangular Notch | Qr | COD (Dr2,C) |
COD (Dr2,R2) |
COD Increment % |
COD (Dr2,R4) |
COD Increment % | COD (Dr2,R8) |
COD Increment % |
| 0.6899 | 0.899 | 0.906 | 0.754 | 0.913 | 1.580 | 0.927 | 3.124 | |
| 0.492 | 0.873 | 0.879 | 0.644 | 0.884 | 1.289 | 0.886 | 1.510 | |
| 0.369 | 0.704 | 0.845 | 19.970 | 0.858 | 21.829 | 0.870 | 23.638 | |
| 0.246 | 0.680 | 0.828 | 21.833 | 0.841 | 23.733 | 0.860 | 26.596 | |
| 0.123 | 0.664 | 0.799 | 20.416 | 0.826 | 24.409 | 0.843 | 27.046 |
| Triangular Notch | Qr |
COD (Dr3,C) |
COD (Dr3,T2) |
COD Increment % |
COD (Dr3,T4) |
COD Increment % |
COD (Dr3,T8) |
COD Increment % |
|---|---|---|---|---|---|---|---|---|
| 0.6899 | 0.828 | 0.864 | 4.321 | 0.878 | 6.023 | 0.890 | 7.471 | |
| 0.492 | 0.799 | 0.839 | 4.992 | 0.855 | 6.987 | 0.876 | 9.597 | |
| 0.369 | 0.582 | 0.829 | 42.300 | 0.841 | 44.332 | 0.849 | 45.826 | |
| 0.246 | 0.558 | 0.810 | 45.211 | 0.815 | 46.125 | 0.828 | 48.428 | |
| 0.123 | 0.549 | 0.725 | 32.116 | 0.778 | 41.601 | 0.787 | 43.392 | |
| Rectangular Notch | Qr | COD (Dr3,C) |
COD (Dr3,R2) |
COD Increment % | COD (Dr3,R4) |
COD Increment % | COD (Dr3,R8) |
COD Increment % |
| 0.6899 | 0.828 | 0.831 | 0.385 | 0.837 | 1.155 | 0.878 | 5.997 | |
| 0.492 | 0.799 | 0.809 | 1.275 | 0.810 | 1.418 | 0.856 | 7.120 | |
| 0.369 | 0.582 | 0.787 | 35.071 | 0.801 | 37.565 | 0.836 | 43.569 | |
| 0.246 | 0.558 | 0.747 | 33.928 | 0.750 | 34.474 | 0.810 | 45.223 | |
| 0.123 | 0.549 | 0.705 | 28.309 | 0.731 | 33.097 | 0.778 | 41.692 |
These tables were replicated for the other diameters (i.e., D2, D3, and D4) with five discharge rates Q1, Q2, Q3, Q4 and Q5. This means that the total number of experiments was 140. During this, the parameters (i.e., water-conveying tunnel, the bend, shaft orientation, and crest shape were maintained to be 0.6 m long, 90 degrees vertical and circular, respectively.
2.2.5. Documenting Measurements
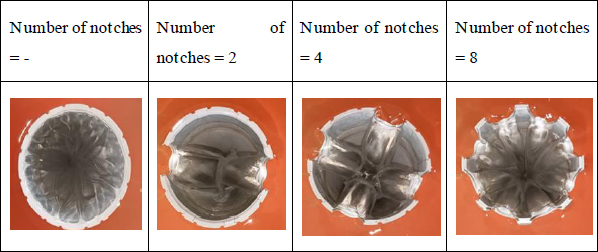
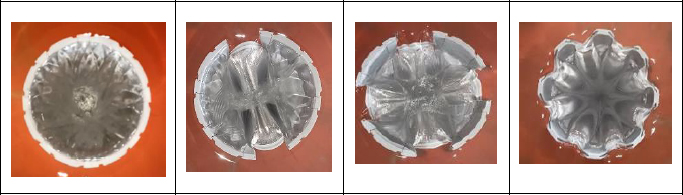
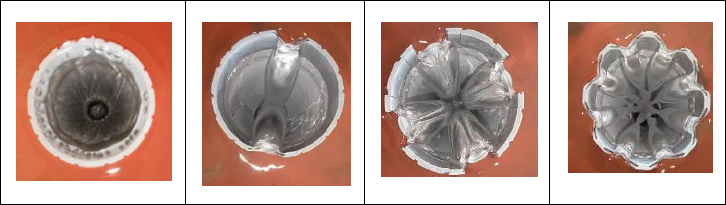
During the experimental procedure, measurements were undertaken; photographs were captured, and observations were documented, from which were the following:
• At low flow rates, free flow occurred; for all investigated cases (Fig. 7).
• The flow experienced an orifice-flow condition at higher flow rates, and vortices were formed, especially for D1 and D2; (Fig. 8).
• The notches caused a reduction in water level due to vortex delay, especially for D3 and D4; (Fig. 9).
| Triangular Notch | Qr |
COD (Dr4,C) |
COD (Dr4,T2) |
COD Increment % |
COD (Dr4,T4) |
COD Increment % |
COD (Dr4,T8) |
COD Increment % |
|---|---|---|---|---|---|---|---|---|
| 0.6899 | 0.726 | 0.740 | 1.946 | 0.770 | 6.098 | 0.796 | 9.661 | |
| 0.492 | 0.661 | 0.702 | 6.133 | 0.712 | 7.714 | 0.754 | 13.998 | |
| 0.369 | 0.442 | 0.617 | 39.493 | 0.661 | 49.478 | 0.685 | 54.723 | |
| 0.246 | 0.372 | 0.585 | 57.431 | 0.631 | 69.814 | 0.664 | 78.552 | |
| 0.123 | 0.244 | 0.557 | 127.913 | 0.561 | 129.786 | 0.594 | 143.135 | |
| Rectangular Notch | Qr | COD (Dr4,C) |
COD (Dr4,R2) |
COD Increment % | COD (Dr4,R4) |
COD Increment % | COD (Dr4,R8) |
COD Increment % |
| 0.6899 | 0.726 | 0.728 | 0.329 | 0.749 | 3.266 | 0.779 | 7.424 | |
| 0.492 | 0.661 | 0.684 | 3.442 | 0.704 | 6.528 | 0.733 | 10.914 | |
| 0.369 | 0.442 | 0.596 | 34.817 | 0.644 | 45.593 | 0.673 | 52.205 | |
| 0.246 | 0.372 | 0.568 | 52.749 | 0.614 | 65.127 | 0.630 | 69.460 | |
| 0.123 | 0.244 | 0.508 | 107.933 | 0.540 | 120.902 | 0.569 | 132.774 |
3. RESULTS ANALYSIS AND DISCUSSION
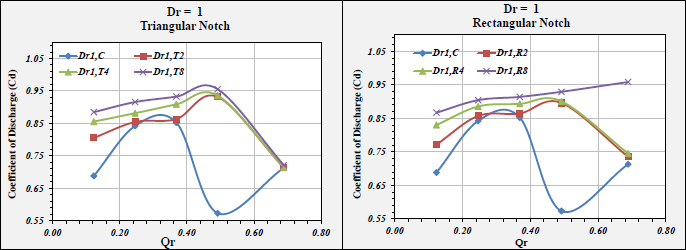
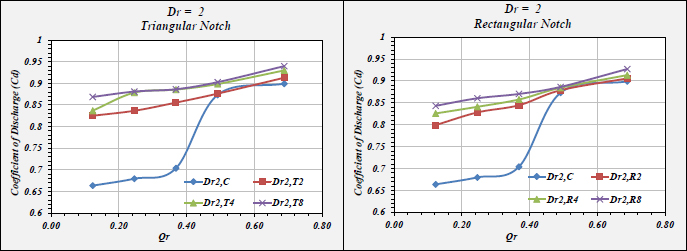
During the analysis process, the investigated parameters were set to be dimensionless. The diameters were related to D1=2 inches to be Dr1, Dr2, Dr3, and D4, equal to 1, 2, 3, and 4, respectively. The discharges were related to Q1=80 l/s, which were equal to Qr1, Qr2, Qr3, Q4, and Q5, equal to 0.689, 0.492, 0.369, 0.246, and 0.123, respectively. Moreover, “Hc” is the water height above the spillway crest and “Hn” is the water height in the notch.
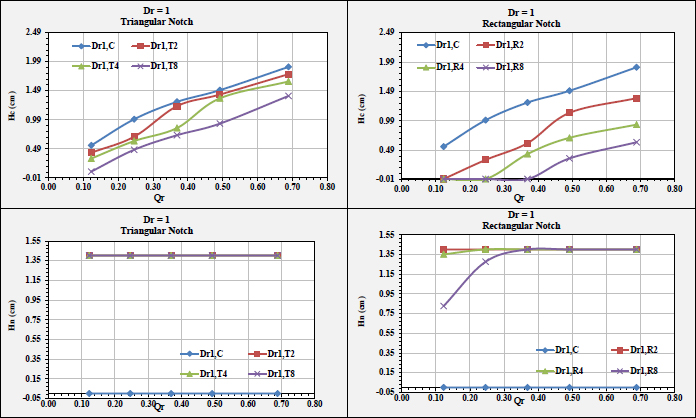
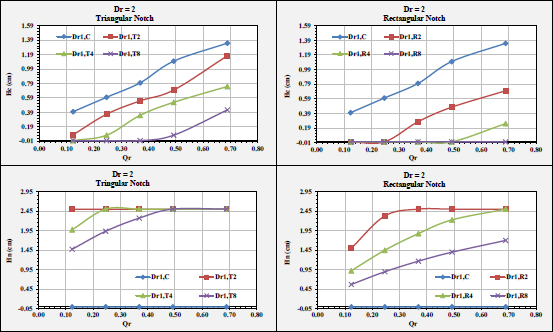
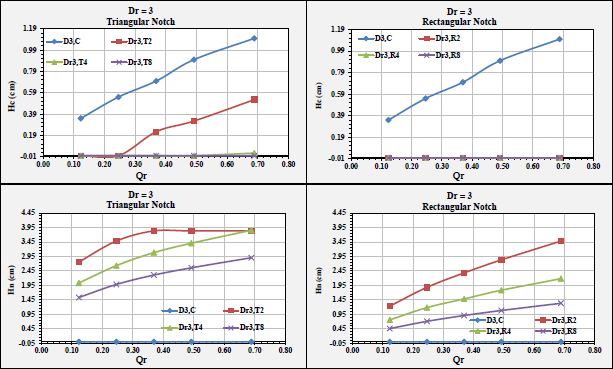
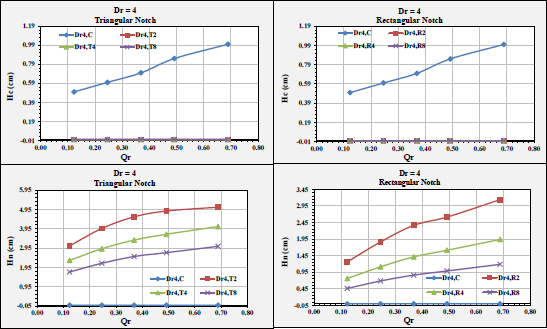
3.1. Impact Of Spillway Inlet Geometric Properties On Rc
Based on the Analysis, the impact of the spillway inlet geometric properties on RC “Rating Curves” were determined and are presented in Figs. (10 and 11). These were the following results:
• At a constant discharge, the water level decreased. This is attributed to the presence of notches.
• At higher discharges, Hn was almost identical for all shapes.
• At low discharges, Hn decreased according to the notch shape, whereas Hc increased or decreased according to the discharge.
• The submergence depth was obvious in the rectangular notch case rather than the triangular-notch case. This is accredited to the larger surface area of a rectangular notch rather than a triangular notch, even though they have identical widths and heights.
• At Dr = 1, Hc was more than Hn for all discharges. This is attributed to the fact that the notches were full; (Fig. 10).
• At Dr=2, Hn varies significantly for both notch shapes (i.e., triangular and rectangular), (Fig. 11).
• For Dr = 3 and 4, HC was trivial. This is acknowledged by the notches, where water passes through them; (Figs. 12 and 13), respectively.
Unlike low discharges, where the water levels inside the notches were similar, for all investigated cases, they were different at higher discharges.
3.2. Impact Of Spillway Inlet Geometric Properties on COD
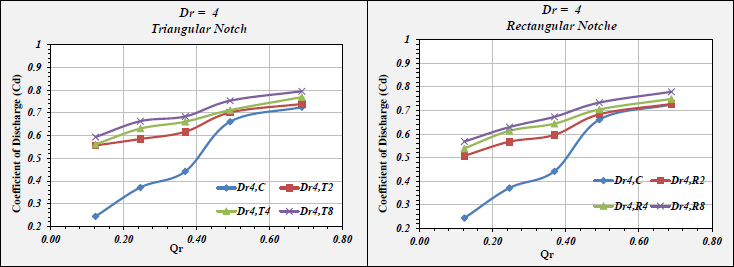
Based on the Analysis, the impacts of spillway inlet geometric properties on COD “Coefficient Of Discharge” were designated and provided in Figs. (14 to 17). In addition, the COD increment percentages are listed in Tables 8 to 11. From the figures and tables, the results were as follows:
• For the investigated notches, the value of COD increased exponentially, where the COD increment value of a triangular case was greater than rectangular.
• For the triangular and rectangular cases, the efficiency of outlet flow was higher than the reference case (i.e., without notches). At Dr1, at lower discharge, COD was higher than Dr2.
• At Dr2, at higher discharge, COD was higher than Dr1. This is attributed to the fact that the flow is free. Moreover, the free flow had a stronger impact on the notches that affected COD.
• At Dr1, in the triangular case, COD attained the highest value except for Qr1, where the rectangular provided higher values.
• Dr4 was the optimum case in terms of COD improvement %.
| Triangular Notch | Qr |
COD (Dr1, C) |
COD (Dr1,T2) |
COD Increment % |
COD (Dr1,T4) |
COD Increment % |
COD (Dr1,T8) |
COD Increment % |
|---|---|---|---|---|---|---|---|---|
| 0.6899 | 0.713 | 0.714 | 0.057 | 0.715 | 0.285 | 0.721 | 1.122 | |
| 0.492 | 0.573 | 0.931 | 62.477 | 0.936 | 63.193 | 0.955 | 66.648 | |
| 0.369 | 0.852 | 0.863 | 1.318 | 0.909 | 6.656 | 0.933 | 9.433 | |
| 0.246 | 0.842 | 0.854 | 1.420 | 0.881 | 4.668 | 0.916 | 8.750 | |
| 0.123 | 0.688 | 0.806 | 17.049 | 0.856 | 24.317 | 0.885 | 28.559 | |
| Rectangular Notch | Qr | COD (Dr1, C) |
COD (Dr1,R2) |
COD Increment % | COD (Dr1,R4) |
COD Increment % | COD (Dr1, R8) |
COD Increment % |
| 0.6899 | 0.713 | 0.735 | 3.097 | 0.745 | 4.482 | 0.958 | 34.405 | |
| 0.492 | 0.573 | 0.896 | 56.37 | 0.901 | 57.103 | 0.929 | 62.105 | |
| 0.369 | 0.852 | 0.865 | 1.450 | 0.893 | 4.819 | 0.914 | 7.270 | |
| 0.246 | 0.842 | 0.857 | 1.788 | 0.885 | 5.132 | 0.904 | 7.381 | |
| 0.123 | 0.688 | 0.772 | 12.117 | 0.830 | 20.627 | 0.867 | 25.984 |
| Triangular Notch | Qr |
COD (Dr2,C) |
COD (Dr2,T2) |
COD Increment % |
COD (Dr2,T4) |
COD Increment % |
COD (Dr2,T8) |
COD Increment % |
|---|---|---|---|---|---|---|---|---|
| 0.6899 | 0.899 | 0.913 | 1.527 | 0.930 | 3.408 | 0.940 | 4.516 | |
| 0.492 | 0.873 | 0.876 | 0.339 | 0.898 | 2.883 | 0.903 | 3.378 | |
| 0.369 | 0.704 | 0.856 | 21.535 | 0.886 | 25.801 | 0.886 | 25.908 | |
| 0.246 | 0.680 | 0.837 | 23.102 | 0.878 | 29.257 | 0.881 | 29.624 | |
| 0.123 | 0.664 | 0.825 | 24.321 | 0.837 | 26.112 | 0.869 | 30.874 | |
| Rectangular Notch | Qr | COD (Dr2,C) |
COD (Dr2,R2) |
COD Increment % | COD (Dr2,R4) |
COD Increment % | COD (Dr2,R8) |
COD Increment % |
| 0.6899 | 0.899 | 0.906 | 0.754 | 0.913 | 1.580 | 0.927 | 3.124 | |
| 0.492 | 0.873 | 0.879 | 0.644 | 0.884 | 1.289 | 0.886 | 1.510 | |
| 0.369 | 0.704 | 0.845 | 19.970 | 0.858 | 21.829 | 0.870 | 23.638 | |
| 0.246 | 0.680 | 0.828 | 21.833 | 0.841 | 23.733 | 0.860 | 26.596 | |
| 0.123 | 0.664 | 0.799 | 20.416 | 0.826 | 24.409 | 0.843 | 27.046 |
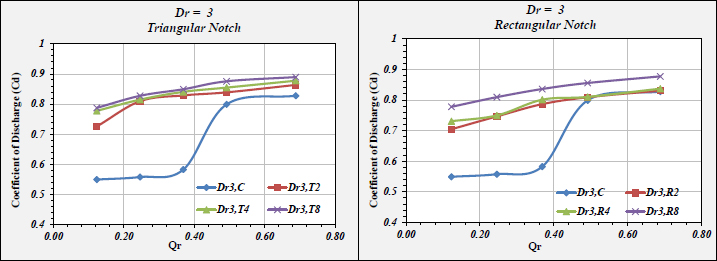
| Triangular Notch | Qr |
COD (Dr3,C) |
COD (Dr3,T2) |
COD Increment % |
COD (Dr3,T4) |
COD Increment % |
COD (Dr3,T8) |
COD Increment % |
|---|---|---|---|---|---|---|---|---|
| 0.6899 | 0.828 | 0.864 | 4.321 | 0.878 | 6.023 | 0.890 | 7.471 | |
| 0.492 | 0.799 | 0.839 | 4.992 | 0.855 | 6.987 | 0.876 | 9.597 | |
| 0.369 | 0.582 | 0.829 | 42.300 | 0.841 | 44.332 | 0.849 | 45.826 | |
| 0.246 | 0.558 | 0.810 | 45.211 | 0.815 | 46.125 | 0.828 | 48.428 | |
| 0.123 | 0.549 | 0.725 | 32.116 | 0.778 | 41.601 | 0.787 | 43.392 | |
| Rectangular Notch | Qr | COD (Dr3,C) |
COD (Dr3,R2) |
COD Increment % | COD (Dr3,R4) |
COD Increment % | COD (Dr3,R8) |
COD Increment % |
| 0.6899 | 0.828 | 0.831 | 0.385 | 0.837 | 1.155 | 0.878 | 5.997 | |
| 0.492 | 0.799 | 0.809 | 1.275 | 0.810 | 1.418 | 0.856 | 7.120 | |
| 0.369 | 0.582 | 0.787 | 35.071 | 0.801 | 37.565 | 0.836 | 43.569 | |
| 0.246 | 0.558 | 0.747 | 33.928 | 0.750 | 34.474 | 0.810 | 45.223 | |
| 0.123 | 0.549 | 0.705 | 28.309 | 0.731 | 33.097 | 0.778 | 41.692 |
| Triangular Notch | Qr |
COD (Dr4,C) |
COD (Dr4,T2) |
COD Increment % |
COD (Dr4,T4) |
COD Increment % |
COD (Dr4,T8) |
COD Increment % |
|---|---|---|---|---|---|---|---|---|
| 0.6899 | 0.726 | 0.740 | 1.946 | 0.770 | 6.098 | 0.796 | 9.661 | |
| 0.492 | 0.661 | 0.702 | 6.133 | 0.712 | 7.714 | 0.754 | 13.998 | |
| 0.369 | 0.442 | 0.617 | 39.493 | 0.661 | 49.478 | 0.685 | 54.723 | |
| 0.246 | 0.372 | 0.585 | 57.431 | 0.631 | 69.814 | 0.664 | 78.552 | |
| 0.123 | 0.244 | 0.557 | 127.913 | 0.561 | 129.786 | 0.594 | 143.135 | |
| Rectangular Notch | Qr | COD (Dr4,C) |
COD (Dr4,R2) |
COD Increment % | COD (Dr4,R4) |
COD Increment % | COD (Dr4,R8) |
COD Increment % |
| 0.6899 | 0.726 | 0.728 | 0.329 | 0.749 | 3.266 | 0.779 | 7.424 | |
| 0.492 | 0.661 | 0.684 | 3.442 | 0.704 | 6.528 | 0.733 | 10.914 | |
| 0.369 | 0.442 | 0.596 | 34.817 | 0.644 | 45.593 | 0.673 | 52.205 | |
| 0.246 | 0.372 | 0.568 | 52.749 | 0.614 | 65.127 | 0.630 | 69.460 | |
| 0.123 | 0.244 | 0.508 | 107.933 | 0.540 | 120.902 | 0.569 | 132.774 |
| Notch Type | Equation |
|---|---|
| Triangular Notch | COD = -0.048 Ln (Dr) Ln (Qr) Ln(n+1) - .0009 Ln (Qr) Ln(n+1) - 0.035 Ln (Dr) Ln(n+1) + 0.0568 Ln (Dr) Ln (Qr) + 0.0524 Ln(n+1) + 0.0308 Ln (Qr) + 0.0575 Ln (Dr) + 0.7799 (19) |
| Rectangular Notch | COD = -0.076 Ln (Dr) Ln (Qr) Ln(n+1) + .0213 Ln (Qr) Ln(n+1) - 0.08 Ln (Dr) Ln(n+1) + 0.073 Ln (Dr) Ln (Qr) + 0.0935 Ln(n+1) + 0.0137 Ln (Qr) + 0.0782 Ln (Dr) + 0.7541 (20) |
3.3. Established Equations
A multiple regression analysis was carried out, and 2 formulae (19) and (20) were established. They correlated the different spillway parameters with COD “Coefficient Of Discharge” for triangular and rectangular cases. Table 12 presents the established eqs.
It is worth mentioning that eqs. (19) and (20) are applicable within the range of Qr between 0.123 and 0.689. Moreover, the eqs. are valid for spillways with notches under free flow.
CONCLUSION AND RECOMMENDATIONS
In this research work, the impact of the proposed rectangular-shaped and triangular-shaped spillways with the different numbers of notches on COD was assessed regarding their hydraulic performance.
Based on the Analysis of the undertaken measurements, the following conclusions were deduced:
• Notches increase the hydraulic performance in circular spillways as they maintain flow freely.
• Notches are more efficient, especially at low discharges.
• Smaller diameters transform the free flow to orifice flow. Accordingly, COD decreases.
• Implementing notches is preferable in terms of COD, as they increase the crest diameter of the spillway.
• The COD of the circular spillway with triangular notches is more efficient than that with rectangular notches. This is accredited to the triangular notch with an acute angle, which creates higher turbulence at the notch. Accordingly, a higher COD is attained.
• Eight triangular notches provided a COD increment percentage of 143% higher than the reference case.
• The established empirical eqs. 18 and 19 could assist engineers during spillway design within the range of Qr between 0.123 and 0.689
In general, this study has shown that the presence of notches improves the efficiency of circular spillways compared to the reference case, whether these notches are triangular or rectangular. Triangular notches are more efficient due to the acute angle that creates higher turbulence, resulting in a higher discharge coefficient. Additionally, increasing the number of notches increases the discharge coefficients.
RECOMMENDATIONS
Based on the above conclusions, the following recommendations were suggested:
• Future studies should be conducted to inspect the impact of trapezoidal notches and right-angle triangles.
• Future studies should investigate the effect of a notch area rather than a notch-(base-to-width value).
• Future investigations should be achieved to inspect the impact of the flow state on the circular spillway with notches (i.e., free-orifice- pipe).
LIST OF ABBREVIATIONS
| USBR | = United States Bureau of Reclamation. |
| MGSs | = Morning-Glory-Spillway |
| COD | = Coefficient of Discharge |
CONSENT FOR PUBLICATION
Not applicable.
AVAILABILITY OF DATA AND MATERIALS
The data and supportive information are available within the article.
FUNDING
None.
CONFLICT OF INTEREST
The authors declare no conflict of interest, financial or otherwise.
ACKNOWLEDGEMENTS
Declared none.

