All published articles of this journal are available on ScienceDirect.

Field Tests of Soil Properties under Water Tanks
Abstract
Aim
This paper aimed to show through the achieved results the characteristics of the soil for the placement of water tanks in the study area (located on the northern side of the city of Prizren).
Objectives
CPT, CPTU, VST, and DMT procedures have been used to determine the research area's necessary and adequate parameters in order to construct the engineering object.
Introduction
The purpose of the study was to understand and characterize a place for the purpose of building engineering objects, for which field tests of soil qualities are crucial.
Methods
A work methodology with two phases was employed to complete the project. Fieldwork was the focus of the first stage, while analysis, interpretation, and paper writing comprised the second stage that followed.
Results
The ASTM D 1586 and AASHTI T-206 standards' requirements were followed in carrying out the tests. In the static penetration test, a pipe with a diameter of 36 mm and a surface area of 10 cm2 was utilized, and the test was conducted by placing the pipe vertically on the ground and measuring the number of blows. According to ASTM D1194, the plate loading test was conducted. The groundwater level was discovered to be at a depth of 4 m, while the static penetration test revealed the sand layer to have a respectable thickness. The values of the substrate reaction modulus (Ks) ranged from 17x104 to 22x104 kN/m3. Ten vertical tests using the plate-shear test method were also conducted in this study region, and the results are displayed in Fig. (10) (p-curve). The results of this work are a very important tool in the examination and analysis of land for the construction of various construction facilities, providing an example for engineers of how the procedures should be analyzed.
Conclusion
The area studied in this work is located in Prizren's northern region. In medium- to dense-grained soils, the findings of the common penetration test and the plate load test may be comparable. A plate bearing test can be used to predict the bearing capacity of a superficial layer of soil without the need for an extensive soil analysis, which will save time and money. Alternative tactics, such as plate-bearing tests, may be employed if comprehensive investigations are not practical.
1. INTRODUCTION
Field tests of soil properties are very important to characterize a location for the purpose of construction of engineering works (objects). The penetration test to determine the “in situ” characteristics of the land is performed according to the standards [1]. So, the standard penetration test (SPT) represents a simple method of dynamic testing “in situ”, which is widely used to determine the characteristics of soils; it is a method to evaluate the relative density of soils and the approximate shear strength parameters. In 1902, the Raymond Pile Company developed this method and found it to be widely used in the field of construction engineering throughout the world, while standards, such as ASTM D 1586 and AASHTO T-206, are used to guide the SPT method. According to A. Hossain et al. [2], the stratigraphy is determined using a variety of in situ tests, which also directly evaluate the soil's characteristics and geotechnical factors [3]. Piezocone (CPTu) test, flat dilatometer (DMT), pressure meter test (PMT), vane shear test (VST), standard penetration test (SPT), and others are popular tests. Each test makes use of a different loading method to identify the pertinent soil reaction and evaluate material qualities, like strength and/or stiffness [4]. The SPT, like the conventional PMT and VST, requires boreholes. For these tests, a rotary drilling rig and crew are needed. The CPT, CPTU, and DMT are all “direct-push” techniques since no boreholes are required. For some varieties of PMT (full displacement type) and VST, boreholes are not required. Either conventional drill rigs or transportable hydraulic systems can be used to push the probes directly to the necessary test depths (cone trucks). Several types of truck-mounted and track-mounted equipment that can be used for production penetrating testing are shown in Fig. (1). The covered cabins allow for the timely scheduling of in situ testing in all weather conditions [5]. Direct push techniques have the drawback that bedrock and hard-cemented layers will hinder further penetration. When this happens, borehole procedures are more effective since they can be enhanced using coring or non-coring approaches. Direct push soundings have the benefit of producing no clippings or spoil. In the structural study of foundation components, the connection between soil pressure and deflection, often referred to as the modulus of subgrade reaction, is widely used. For matting, continuous footings, and other types of piling, it is used. The most common and cost-effective method for gathering subsurface information at the moment is the basic penetration test [6]. Correlations of unit weight, relative density, angle of internal friction, and undrained compressive strength were created using the SPT data (qu). The stress-strain modulus “Es” and the foundations' bearing capacity have both been determined using it. This study has evaluated the outcomes of SPT and PLT trials on the coveted alluvium's grave soils. The outcomes have also shown a connection between the SPT results and the modulus of subgrade response (Ks) for grave soils (N1) [7, 8]. However, the findings of penetration tests have been looked at for sandy soil.
2. MATERIALS AND METHODS
In this work, a work methodology based on two phases was used. The first phase consisted of fieldwork and the second phase consisted of the analysis, interpretation, and writing of the paper. Working materials, equipment, and tools were used to carry out field tests using methods as follows: penetration tests, plate load tests, and SPT.
3. RESULTS AND DISCUSSION
3.1. In Situ Test Methods
With in situ technology, it is expected that it would be feasible to analyze the soil status instantly. It will take some time to collect data and make conclusions from the laboratory testing method in the case of the soil sampling technique. We have recently used a variety of in situ testing procedures depending on the site and the type of structure [1-3].
3.2. Static Penetration Test
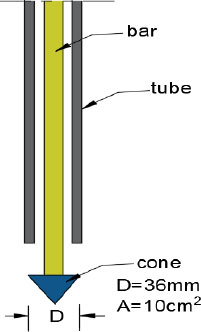
Static penetration tests (Fig. 1) are used in the field to gauge a cone's resistance to piercing under the influence of static force. Hydraulic presses are used to apply indentation force, with the drawbacks of heavier loads requiring more anchors. These involve a freely moving steel rod with a diameter of 15 mm, a steel cone on top, and a hollow tube with a diameter of 36 mm. The 36 mm diameter cone is the most popular; however, the 45mm cone is also utilized. The tube and cone penetrometer's cross-section measurements are depicted in the bridge.
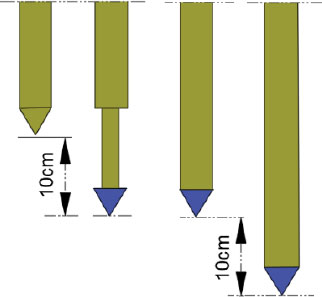
In the first step of the static penetration tests, only cones were crushed at a depth of 10 cm using rods. On this occasion, we measured the resistance to cone penetration. When assessed for lateral friction, just enough of the second phase was injected to allow the pipe to join the cone. To achieve a full sinking of about 20 centimeters, the third stage involved pressing the cone and pipe together by an additional 10 cm. In Fig. (2), the phase of the field testing during the static penetration tests represents the overall penetration resistance.
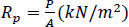
The following equation indicates the resistance to penetration:
 |
(1) |
Where,
A is the cross-sectional area of the cone and
P is an impressive force.
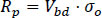
The soil surrounding the cone remained flexible as it penetrated the earth; the resistance to cone penetration can be illustrated as follows:
 |
(2) |
 |
(3) |
Where,
σ 0 is the internal soil friction angle
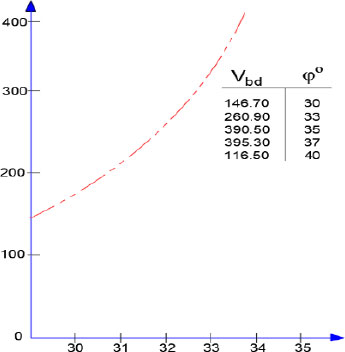
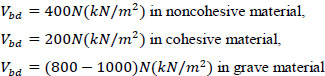
The observed depth of the higher soil layers has been found to be under effective stress. The angle of internal friction ϕ can be computed using resistance to penetration and these relationships. However, this cannot be calculated based on the friction angle for coherent layers due to the effect of pore pressure that occurs during the process of penetrating coherent materials. The correlation between internal friction coefficient Vbd and angle ϕ is depicted in Figs. (3 and 4).
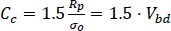
According to Buisman, there is a direct correlation between the compressibility index Cc and the resistance to cone Rp penetration:
 |
(4) |
It should be underlined that only sparingly should this particular value of the coefficient Cc be employed. Some tables show how the relative density, consistency index, and uniaxial strength relate to the resistance to cone penetration that may be found in the pertinent research.
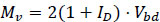
Cone penetration resistance (Vbd) and non-cohesive material compression modulus (Mv) were found to be correlated by Buisma [9, 10].
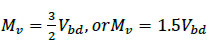 |
(5) |
De Beer (1948) coined the following formula while researching the predicted and observed settling of bridges on sand:
 |
(6) |
According to Vesi, the relative density affects the compressibility modulus, and a correlation between the two has been identified [11]:
 |
(7) |
Where, for completely loose sand stems Mv=2Vbd and for compacted ones, Mv=4Vbd.
The following correlations for sand materials were used in Belgium to establish a parallel assessment of the static penetration test and the SPT:
 |
(8) |
Where,
N is the number of blows at SPT.
Suklje proposed the following expression based on information from the literature:
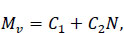 |
(9) |
Where,
2000 < C1 < 4000 and 400 < C2 < 800.
3.3. Standard Penetration Test (SPT)
The main objective of this test is to assess the relative densities of the penetrating cohesionless soils. To determine the in situ characteristics of the soil, the standard penetration test (SPT) is carried out according to the standards required for the soil where the loads act [12-14]. The test is particularly suitable for obtaining results by drilling into soils to agitate a moving sample and to provide a rough assessment of the soil's dynamic resistance. The Raymond Pile Company developed the test in 1902 and it is now widely used for in situ testing worldwide. ASTM D 1586 and AASHTO T-206 both provide thorough instructions for the SPT. A hollow, thick-walled tube is driven into the ground, and the sampler is moved 300 mm (1 foot) vertically by counting the number of blows. A 63.5 kg hammer is repeatedly lowered from 0.76 m (30 inches) using a drop-weight mechanism to create three sequential increments of 150 mm (6 inches).
The N-value (blow count) or SPT-resistance is the total number of blow counts necessary to advance the second and third increments, while the first increment is referred to as ”seating” (measured in blows per 0.3 m). If the sampler cannot be pushed 450 mm, the number of blows for each 150 mm increment and each half increase is noted on the boring log. For partial increments, the depth of penetration is indicated along with the total number of blows.
The test may be used to determine several types of soil and weak rocks; however, it is not particularly helpful in determining soft clays or gravel deposits. The test's ability to offer both a sample and a number is helpful, but it is troublesome because it is impossible to accomplish two things well at once. The SPT is carried out at the bottom of a soil boring that has been prepared using either flight augers or rotary wash drilling techniques.
The drilling operation is halted periodically to carry out the SPT. At depths shallower than 7 meters, tests are typically done every 1.5 meters, and every 2.0 meters after that. The water head of the borehole must be kept at or above the ambient groundwater level to avoid water intrusion and borehole instability. The effective overburden pressure ('v), drilling rod length, borehole diameter, sample technique, and hammer type are some of the variables that affect the SPT below counts [15]. Therefore, many modifications to the fundamental number of blows acquired in SPT tests have been suggested by researchers to determine a reasonable index for measuring soil density and resistance. The NCEER-98 study for granular soils by Roberts and Wride has provided the most thorough relations [16]. By converting the measured N to N60 as follows, the discrepancies in testing processes may be at least adjusted for Skempton [17, 18]. The adjusted SPT below the 60% energy level is calculated using this method using the following relation:
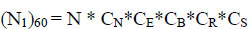 |
(10) |
Where,
N - counted SPT below measured
CE - depending on the type of hammer, the energy effect coefficient
CB - borehole diameter correction factor;
CR - corrected rod length factor
CS - modification factor for sampler type (with or without liners)
CN - the equation used to calculate the effective overburden pressure coefficient:
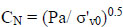 |
(11) |
Where,
Pa - atmospheric pressure
σ'v0 - actual vertical pressure at the depth being considered
The optimum correction factors according to NCEER guidelines are shown in Tables 1-3.
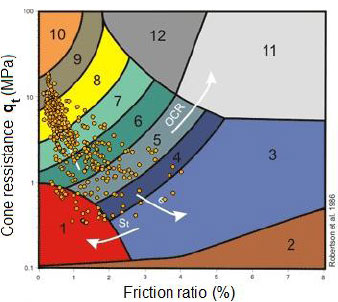
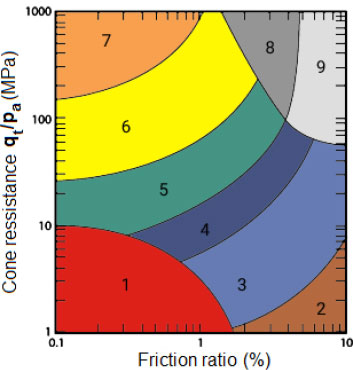
It is not essential to provide soil parameters during the classification of soils [19]; the program completes this phase automatically by assigning them to the geological profile (Table 4). As a result, the CPT evaluation is completed quickly and with great clarity. According to Robertson (2010), the classification of soils is based on the measurement of penetration resistance (qc), local skin friction (fs), and pore pressure (u2). Based on the graphs below, the software determines the soil behavior type (SBT) based on the corrected results of the friction ratio Rf = fs/qt.pa and the cone resistance qt = qc + u2 * (1 - a), or percentage ratio qc/pa, when atmospheric pressure equals 100 kPa (or 1tsf).
| Factor | Equipment Variable | Term | Correction |
|---|---|---|---|
| Overburden pressure | - | CN | (PA/σV)0.5 |
| Overburden pressure | - | CN | CN≤1.7 |
| Energy ratio | Donut hammer | CE | 0.5-1.0 |
| Energy ratio | Safety hammer | CE | 0.7-1.2 |
| Energy ratio | Automatic-trip donut-type hammer | CE | 0.8-1.3 |
| Borehole diameter | 65-115 mm | CB | 1.0 |
| Borehole diameter | 150 mm | CB | 1.05 |
| Borehole diameter | 200 mm | CB | 1.15 |
| Rod length | <3m | CR | 0.75 |
| Rod length | 3-4 m | CR | 0.8 |
| Rod length | 4-6 m | CR | 0.85 |
| Rod length | 6-10 m | CR | 0.95 |
| Rod length | 10-30 m | CR | 1.0 |
| Sampling method | Standard sampler | CS | 1.0 |
| Sampling method | Sampler without liners | CS | 1.1-1.3 |
| Depth | γ (gr/cm3) | FN = Fine Content | σv (kPa) | σv’ (kPa) | WT (m) | rd | CSR (E) |
|---|---|---|---|---|---|---|---|
| 1.5 | 1.7 | 4 | 30.0 | 25.1 | 0.50 | 0.9904198 | 0.308 |
| 2.0 | 1.8 | 4 | 56.5 | 46.7 | 1.00 | 0.9866568 | 0.310 |
| 2.5 | 1.8 | 4 | 83.0 | 68.3 | 1.50 | 0.9830160 | 0.311 |
| 3.5 | 1.8 | 4 | 109.5 | 85.0 | 2.50 | 0.9760058 | 0.327 |
| 5.0 | 1.8 | 4 | 136.0 | 96.7 | 4.00 | 0.9654794 | 0.353 |
| 6.5 | 1.8 | 4 | 162.5 | 108.5 | 5.50 | 0.9533443 | 0.371 |
| 8.0 | 1.8 | 4 | 188.9 | 120.3 | 7.00 | 0.9372247 | 0.383 |
| 9.5 | 1.8 | 4 | 215.4 | 132.0 | 8.50 | 0.9144288 | 0.388 |
| 11.0 | 1.8 | 4 | 241.9 | 143.8 | 10.00 | 0.8827989 | 0.386 |
| 12.5 | 1.8 | 4 | 268.4 | 155.6 | 11.50 | 0.8419743 | 0.378 |
| 14.0 | 1.8 | 4 | 294.9 | 167.4 | 13.00 | 0.7942530 | 0.364 |
| 15.5 | 1.8 | 4 | 321.4 | 179.1 | 14.50 | 0.7440522 | 0.347 |
| 17.0 | 1.8 | 4 | 347.9 | 190.9 | 16.00 | 0.6960849 | 0.330 |
| 18.5 | 1.8 | 4 | 374.3 | 202.7 | 17.50 | 0.6536359 | 0.314 |
| Depth | SPT (field) | CN | CB | CS | CR | N1(60) | CRR (Z) | SF | PL (%) |
|---|---|---|---|---|---|---|---|---|---|
| 1.5 | 120 | 1.41 | 169.51 | 220 | 0.1109 | 0.3605 | 1.5 | 120 | 1.41 |
| 2 | 120 | 1.21 | 145.17 | 220 | 0.0790 | 0.2545 | 2 | 120 | 1.21 |
| 2.5 | 120 | 1.10 | 132.01 | 220 | 0.0649 | 0.2088 | 2.5 | 120 | 1.10 |
| 3.5 | 120 | 1.04 | 124.99 | 220 | 0.0580 | 0.1774 | 3.5 | 120 | 1.04 |
| 5 | 120 | 1.01 | 121.00 | 220 | 0.0543 | 0.1539 | 5 | 120 | 1.01 |
| 6.5 | 120 | 0.98 | 117.58 | 220 | 0.0513 | 0.1381 | 6.5 | 120 | 0.98 |
| 8 | 120 | 0.95 | 114.59 | 220 | 0.0487 | 0.1271 | 8 | 120 | 0.95 |
| 9.5 | 120 | 0.93 | 111.94 | 220 | 0.0464 | 0.1197 | 9.5 | 120 | 0.93 |
| 11 | 120 | 0.91 | 109.58 | 220 | 0.0445 | 0.1153 | 11 | 120 | 0.91 |
| 12.5 | 120 | 0.90 | 107.45 | 220 | 0.0428 | 0.1133 | 12.5 | 120 | 0.90 |
| 14 | 120 | 0.88 | 105.50 | 220 | 0.0413 | 0.1134 | 14 | 120 | 0.88 |
| 15.5 | 120 | 0.86 | 103.73 | 220 | 0.0399 | 0.1149 | 15.5 | 120 | 0.86 |
| 17 | 120 | 0.85 | 102.09 | 220 | 0.0386 | 0.1172 | 17 | 120 | 0.85 |
| 18.5 | 120 | 0.84 | 100.57 | 220 | 0.0375 | 0.1195 | 18.5 | 120 | 0.84 |
| Zone | Soil Behavior Type (SBT) |
|---|---|
| 1 | Discerning fine-grained |
| 2 | Organic substance |
| 3 | Clay |
| 4 | Silty clay to clay |
| 5 | Silty clay to clayey silt |
| 6 | From sandy to clayey sand |
| 7 | Sand to sandy silt to silt |
| 8 | Silty sand to sand |
| 9 | Sand |
| 10 | Sand to gravelly sand |
| 11 | Highly rigid and fine-grained * |
| 12 | Clayey sand to sand * |
| Zone | Soil Behavior Type (SBT) |
|---|---|
| 1 | Sensitive, fine-grained |
| 2 | Organic soils - clay |
| 3 | Clay - silty clay to clay |
| 4 | Silt mixtures - clayey silt to silty clay |
| 5 | Sand mixtures - silty sand to sandy silt |
| 6 | Sands - clean sand to silty sand |
| 7 | Gravelly sand to dense sand |
| 8 | Very stiff sand to clayey sand * |
| 9 | Very stiff fine-grained * |
According to Robertson, the more recent categorization of soils has fewer distinct soil groups than the initial classification (Table 5). However, according to Robertson, soil classification is now more accurate and widely used around the world. Soil classification according to Robertson [4-6] has been depicted in Figs. (5 and 6).
According to Robertson, the more recent categorization of soils has fewer distinct soil groups than the initial classification from 1986 [10-12]. Nevertheless, Robertson's classification of soils is based on their measured penetration resistance (qc), local skin friction (fs), and pore pressure (u2) values [5]. The following figures (Figs. 5 and 6) show how the algorithm automatically calculates the soil behavior type (SBT) based on the corrected value of cone resistance [qt = qc + u2 (1 - a)] or the percentage ratio qc/pa, and the friction ratio Rf = fs/qt, where atmospheric pressure is pa (100 kPa).
3.4. Plate Load Test
Narrow test pits are routinely dug as part of a foundation study in the northern area of Prizren town (up to 100 cm across). To define and test the soil profile, including relative density, such holes are lowered while trained persons are inside. Even at considerable depths, routine on-site testing of gravels is possible due to the enormous diameter of the boreholes. With equipment that could be set up inside a 100 cm diameter borehole, vertical plate stress tests were carried out at the bottom of shallow boreholes. For a small additional fee, these tests can be carried out during routine foundation inspections. Due to the wide range of gravel quality, periodic testing is preferred at each location. The equipment's size and mass were kept to a minimum due to this and the constrained working space in the borehole. The tool comprised a small hydraulic jack with connectors to link a 305 mm diameter circular plate (Fig. 7). The testing technique adhered to ASTM D1194. The plate was positioned in the hole's center. By using a jack, incremental loads of one-fourth to one-fifth of the anticipated ultimate load have been delivered to the plate [18]. Dial gauges were used to track the plate's settlement with each step load application. Each load application stage must be separated by at least an hour. The test was run until failure, or at the very least until the plate had settled by 25 mm. It is not surprising that the concept of modeling soil as an elastic medium was first put forth by Winkler and is now known as the Winkler soil model. By using working examples, like the settlement analysis of shallow flexible foundations and laterally loaded piles, several applications of this idea have been addressed [19, 20]. The most well-known example is that of a horizontal, continuous beam or footing resting on an elastic subgrade. At every given point along the beam, it is believed that the subgrade response is inversely in proportion to the beam's vertical displacement. To put it another way, Hook's law is applied to the soil. Since P is the ground bearing pressure at a particular location along the beam and is the vertical displacement of the beam at that point, Ks is the modulus of subgrade response (Ks) for the soil, which is defined as Ks=P.
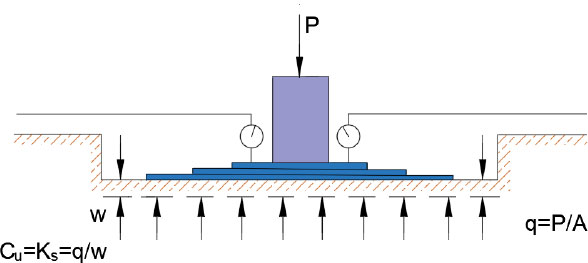
Since soil can be a very variable substance, the key challenge in implementing the Winkler soil model is quantifying the modulus of subgrade reaction (Ks) to be employed in the analysis. Only by conducting in situ plate bearing tests or by somehow connecting it to the intrinsic deformation properties of the soil can Ks be effectively and realistically estimated. In ASTM D1194, the plate bearing test is completely detailed and is often utilized. As shown in Fig. (8), the value of Ks in foundation design is the graph's secant modulus across the anticipated operating range of bearing pressure (p'), as opposed to pavement design. Due to a lack of plate load testing data, only empirical and theoretical correlations are considered. Numerous Ks relation-influencing factors that depend on the shape of the footing and parameter, the least lateral dimension of the footing, the non-dimensional soil mass per unit length, the coefficient of subgrade reaction for a plate 30.5 cm wide, and others, have all been proposed.
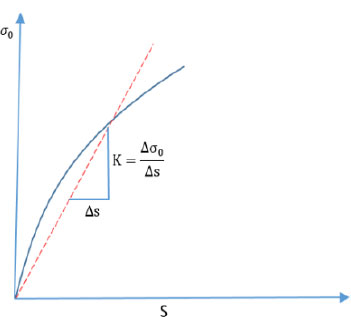
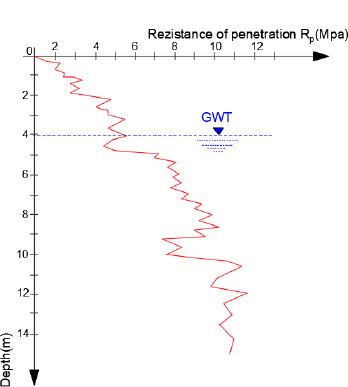
3.4.1. Calculating the Modulus of Subgrade Reaction
The following equation must be used to determine the modulus of subgrade reaction, Ks, in MN/m3 [20-22] (Fig. 8).
 |
(12) |
Where,
σ 0 is the average normal stress in MN/m2;
s is the settlement of the loading plate in m.
To construct the pavements for roads and airports, the modulus of subgrade reaction, which corresponds to an average settlement of 1.25 mm, must be derived from the normal stress (Fig. 7).
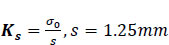
3.5. Static Test for Penetration
Static penetration tests have been performed on sand; the results are shown in the Rp-z diagram. Underneath the circular foundation, having a diameter of D = 10 m, at a depth of Df = 1.0 m, the layer of sand has shown a significant thickness. Groundwater levels were discovered by a field investigation at a depth of 4.0 m. Below the water's surface γ' = 10.0kN/m3, there was sand γ= 17.15kN/m3, bulkier and denser than the groundwater above it. Fig. (9) displays the findings of static piercing tests conducted while looking at test piles.
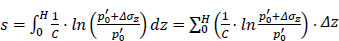
The circular foundation's settling can be calculated using the static penetration value. The Busman-De Beer's expression [23, 24] was applied to determine the settlement of the foundation's center point:
 |
(13) |
Where,
C is the constant of compressibility,
 |
(14) |
Subsidence s = 7.82 cm according to the above equation.
3.6. Standard Penetration Test (SPT)
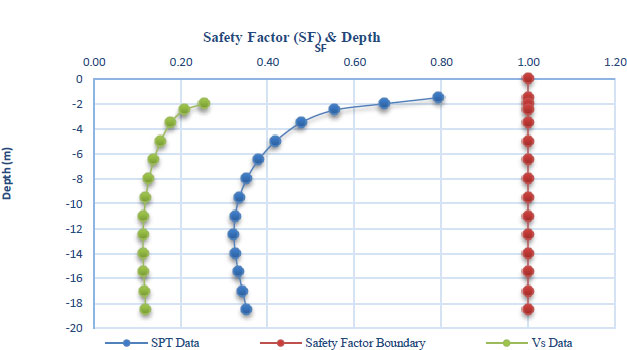
Regular penetration tests have been conducted for each site, and the SPT below numbers have been calculated at corresponding depths [25, 26, 27]. The NCCER-97 (1997) technique has then been used to analyze the adjusted SPT values (N1)60 (Fig. 9). The comparison of SPT results with other geotechnical properties of gravel, such as Ks, would be very helpful given that the standard penetration test has the most impact on geotechnical projects in Kosovo. The information regarding the modulus of subgrade reaction (Ks) and the subsequent corrected SPT values (N1)60 is shown in Table 6.
|
Foundation No. |
USCS Classification |
(N1)60 |
Ks (x104 kN/m3) |
|---|---|---|---|
| 1 | GW-GC | 38 | 20 |
| 2 | GW-GC | 36 | 18 |
| 3 | GW | 44 | 22 |
| 4 | GW-GC | 39 | 21 |
| 5 | GW-GC | 35 | 18 |
| 6 | GP | 33 | 17 |
|
Foundation No. |
Test of Field Plate Loads | |
|---|---|---|
|
Ks (x103 kN/m3) |
qa (kN/m2) |
|
| 3 | 22 | 458.33 |
| 6 | 17 | 354.17 |
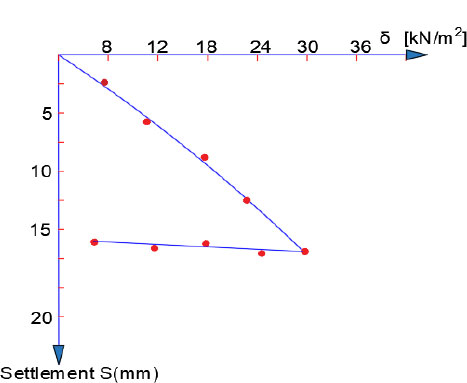
The modulus of subgrade reaction Ks from the Bowles relationship was used to evaluate the permitted bearing capacity:
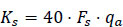 |
(15) |
Where,
qa is the maximum permissible load per square meter (KN/m2) and Fs is the safety factor, which is set at 3. In Table 7, the permitted bearing capacity is displayed.
Where,
Ks =160 × 3× qall. (field) for max. ΔH= 6 mm (according to equation 15)
3.7. Test of Plate Load
Ten vertical plate load investigations on medium- to dense-textured soils have beenconducted in the Prizren alluvium. Fig. (10) shows the measurements of vertical settlement (s) and contact pressure (p) for each test. The secant modulus (Ks) of each graph has then been determined.
CONCLUSION
The area studied in this work is located in the northern part of the city of Prizren. The results obtained during this work showed that the land is suitable for water tanks. The SPT test was performed under ASTM D 1586 and AASHTO T-206 standards. The outcomes of the plate load test and the common penetration test may correspond to medium- to dense-grained soils. In the medium- to dense-gravely soil (Ks), the adjusted SPT below count (N1)60 has been found to be correlated with the modulus of subgrade reactivity. In medium to thick grave soils, the modulus of sub-trade reaction (Ks) and the adjusted SPT below count (N1) 60 have been observed to be enhanced. By bypassing the requirement for significant soil study, a plate bearing test can be used to forecast the bearing capability of a superficial layer of soil, saving time and money. If thorough investigations are not feasible, alternative strategies, such as plate-bearing tests, may be used.
LIMITATIONS
A specific region of Prizren has been studied in this work, which may not be representative of all regions. It may, however, help us ensure the correctness of the results so that the analysis approach and process can be applied in other areas.
SUGGESTIONS FOR FUTURE RESEARCH
The application of software and standards for the examination of soils, bearing capacity, groundwater, and soil layers, as well as realistic assessment to expand and further test the theory and methods, which we have developed here, have a number of drawbacks. These drawbacks include the following:
− Future research can contrast the screening and analysis of the same locations using other techniques.
− The standardization of methodologies and the widespread digitalization of experiments and analysis both require more work.
− Research should be done to create strategies and procedures and to perform a thorough examination of comparisons.
− Additionally, it would be beneficial to qualitatively record the experiences and analyses of other research academics working in this area who have also examined conflicting or unfavorable experiences with the outcomes of using various ways or a combination of methods and standards.
− Software must be developed and used, and the outcomes must be compared with those obtained using conventional methods.
− Global unification of testing and examination standards must be carried out for the purpose of comparing outcomes.
− After the data collection was completed, we came up with one last, relatively specific, but significant question: What is the most appropriate and accurate method and standard for the data collected? This will be determined in subsequent research based on the comparison of the data and the results obtained, particularly the tests and examinations in the field.
LIST OF ABBREVIATIONS
| CPT | = Cone penetration test |
| CPTU | = Piezocone test |
| VST | = Vane share test |
| SPT | = Standard penetration test |
| PLT | = Plate load test |
| DMT | = Dilatometer test |
| ASTM | = American Society for Testing and Materials |
| AASHTO T 206 | = Standard method for penetration test and split-barrel sampling of soils. |
CONSENT FOR PUBLICATION
Not applicable.
AVAILABILITY OF DATA AND MATERIALS
The data supporting this study's findings are available within the article.
FUNDING
The authors received no financial support for the research, authorship, and/or publication of this article.
CONFLICT OF INTEREST
The authors declare no conflict of interest, financial or otherwise.
ACKNOWLEDGEMENTS
The authors want to acknowledge professors and experts from different Peruvian universities whose expertise and shared knowledge contributed to the present study.

