All published articles of this journal are available on ScienceDirect.
Effects of Filter Material on the Permeability of Sapric Peat in Flexible Wall Permeability Tests
Abstract
Introduction
Installation of Prefabricated Vertical Drains (PVDs) is one of the alternatives for ground improvement used in peatland deposits. However, filter paper is commonly used as standard filter material to determine the permeability of peat rather than the PVD material itself.
Aims
This paper presents preliminary data on the effect of using two different filter materials on the permeability behavior of Sapric peat.
Methods
A series of flexible wall permeability tests (FWPTs) was conducted to evaluate the peat permeability behavior under compression using two filter materials. This study compared Whatman standard filter paper and Prefabricated Vertical Drain (PVD), which is a non-woven geotextile filter material.
Results
The results showed that both tests using filter paper and a PVD filter exhibited a high initial coefficient of permeability, which depends on the hydraulic gradient. The coefficient of permeability significantly decreased until a certain period and then diminished with time. The coefficient of permeability from PVD filter tests was found to be approximately 2.6 times higher than that of the standard filter paper under the same compression. The duration required to reach a semi-steady state flow condition from the PVD test was 0.9 times faster than the standard filter paper. The random error of the coefficient of permeability data from the tests using the PVD filter was lower than the data of the standard filter paper.
Conclusion
This preliminary result suggests that standard filter material might not represent the actual coefficient of permeability of Sapric peat. The coefficient of permeability value was less consistent compared to the PVD filter. The selection of filter material plays a crucial role in ensuring accurate and reliable results, especially when dealing with PVD construction in peat. Using the PVD filter in FWPT appears to be suitable for the design of PVD in peat. The findings of this study contribute to evaluating the correct parameters for engineers to design and analyze the effectiveness of the ground treatment method using PVD in peat.
1. INTRODUCTION
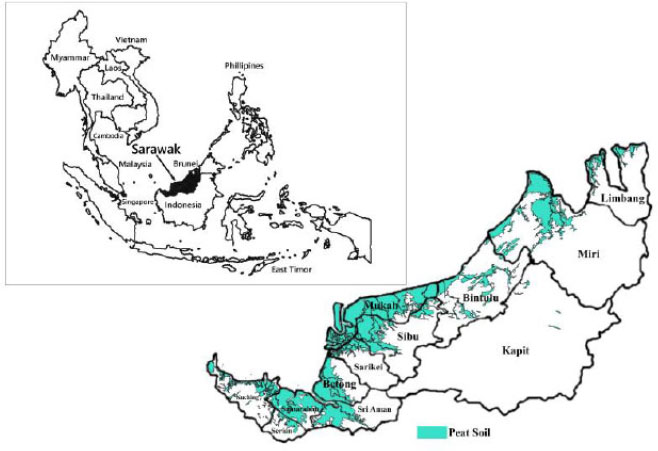
The rapid increase in population is driving infrastructural development, thus increasing the demand for land use, including expansion in peat formation. Peat is an organic soil originating from partially decayed vegetation accumulated over time in waterlogged areas [1-3]. Due to its formation under an anaerobic condition, peat soils are often brown to black [4]. Peat microstructures are hollow, with irregular pores size and a coarse texture compared to clay soil [3, 5]. Approximately 5 to 8% of the world's land surface is covered in extensive peat deposits [6, 7]. In Southeast Asia, it covers roughly 23 million hectares, mostly in lowland tropical regions. In Malaysia, peatland formation covers around 2.7 million hectares of lowland near the coast [8]. About 1.7 million hectares, equating to 63% of the peatland reserve of Malaysia, are in the state of Sarawak, which has the country's greatest peat deposits [9-11]. Fig. (1) illustrates peat deposits along the lowland of Sarawak's shoreline region. Ninety percent (90%) of peat deposits in Sarawak are more than 1.5 meters deep and are classified as deep peat [12, 13]. Due to their low mechanical quality characteristics, many engineers view peats as problematic soil. Peat has a high total porosity, often in the 70-95% range [14]. Porosity affects the water retention of peat, and its moisture content can reach 200% or more [15-17].
Installation of Prefabricated Vertical Drains (PVDs) is one of the alternatives for ground improvement used in peatland deposits [18]. In Sarawak, ground treatment using PVDs might have been introduced since the 1980s. A successful road project on approximately 10 meters depth of fibrous peat using PVD treatment was conducted on the 13.5km single-carriageway link road from Igan Bridge to University Technology Sarawak Campus [19, 20]. However, there was very limited data regarding PVD application in Sapric peat. The PVD shortens the vertical and horizontal drainage paths of the water flow, accelerates the consolidation processes, and, at the same time, increases the undrained shear strength [21, 22].
Hobbs highlights that permeability is the most important property of peat since it determines the settlement rate [23]. In this context, permeability is critical to assure the effectiveness of the peat-PVD system in the ground treatment approach. Fig. (2) shows the installation of PVDs as a ground treatment of a road embankment at one of the construction sites on a coastal highway, where peat was encountered.
Water movement capacities through peat pores are measured as peat permeability characteristics [24, 25]. Permeability plays an important role in controlling the consolidation rate of peat, which will manifest in settlement during construction and post-construction [3, 26]. The initial permeability of peat is typically 1000 times higher than soft clay deposits; however, it will decrease over time [27, 28]. An electrophoretic mobility study by Forsberg and Alden [29] discovered that peat had fine particles of less than one (1) μm. Fine particles of less than two (2) μm in peat are defined as peat colloids [30]. According to Amuda et al. [31], peat colloids have jelly-like texture and no intra-assemblage pore space. Colloids migrate with water during diffusion between peat pores, influencing permeability behavior [1, 29].

Peat has a high void ratio of 5 to 15 [3]. It has been found that large pores and high void ratios influenced the compressibility of peat [31]. When subjected to vertical stress, Mesri and Ajlouni [28] described the compressibility of peat as 5 to 20 times higher than soft clay. Sarawak Department of Public Works (JKRS) spent RM2 mil for maintenance work on the road along the Salim to Sibu Airport bypass at Sibu, Sarawak, which has experienced up to 300mm of differential settlement [9]. This road was constructed in the 1990s by adopting the conventional method of normal filling on approximately 10 meters of peat.
The flexible wall permeability test (FWPT) is commonly conducted to evaluate the soil permeability behavior under compression. For this test, filter paper is used as the standard filter material for any soil sample [32]. The use of other filter materials is not common. Many permeability tests do not focus on the filter material due to the assumption that filter paper does not affect the permeability value. Limited research has been conducted using other filter materials [33] but has not focused on studying the material's effect on the permeability of the soil.
This study presents preliminary data on the effect of using two different filter materials on the permeability behavior of Sapric peat. It compared Whatman standard filter paper and Prefabricated Vertical Drain (PVD) of non-woven geotextile filter materials. The findings of this study contribute to evaluating the correct parameters for engineers to design and analyze the effectiveness of the ground treatment method using PVD in peat.
2. MATERIALS AND METHODS
2.1. Peat Sample
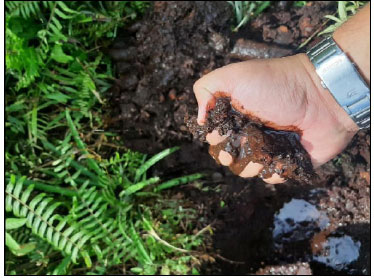
The peat sample was collected from Endap Village in Kota Samarahan, Sarawak, Malaysia, with a global coordinate of 1°25’37.2” N 110°27’32.3” E. Von-Post test using the hand squeezing method conforming to ASTM D 5715 [34] indicated that the collected peat met the H7 humification index criteria (Fig. 3). This peat has a natural moisture content of 1291.7%. The moisture test was carried out using oven dry method according to ASTM D 2974 [35] at a temperature of 110±5°C. This sample contained 98.5% organic content when evaluated based on the high-temperature oxidation method recommended by ASTM D 2974 [35]. The collected peat has a specific gravity of 1.558. The fiber content of this sample was determined using ASTM D 1997 [36], and it was found to be 10.5%. Based on the index test result, the collected samples were classified as Sapric peat according to ASTM D 4427 Standard Classification of Peat Samples by Laboratory Testing [37].
Microphotograph of Scanning Electron Microscope (SEM) shows the microstructures of peat in the sample (Fig. 4a). For comparison, an SEM microphotograph of clay is shown in Fig. (4b) at the same magnification level. Peats show a distinctive characteristic with large pores. The average size of the pores is about 20 μm. Peat pores are interconnected and are classified as macropores when the pores exist between peat particles, whereas the pores inside peat particles are classified as micropores [38, 39]. These pores act actively as a medium for the water to flow in saturated conditions [40, 41]. During this process, water will move through the interconnected pores to other pores.

2.2. Filter Materials
Two types of filter material were compared in this study. The first was the standard filter paper used in ASTM, i.e., Whatman Grade 1, with an average pore size of 11 μm. The second one was the PVD filter material extracted from the PVD filter jacket. The filter jacket sample was extracted from PVD grade HB105 manufactured by TenCate Geosynthetics Asia Sdn. Bhd. This product is widely used for PVD applications worldwide. The apparent opening size of the filter jacket is less than 150 μm. Its coefficient of permeability is 0.5 x 10⁻⁴ m/s or greater. Both filter materials are shown in Fig. (5).

3. FLEXIBLE WALL PERMEABILITY TEST (FWPT)
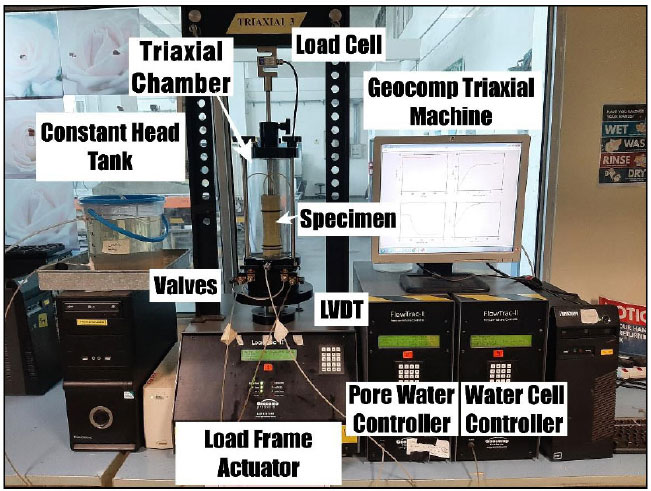
A series of FWPTs was conducted to investigate the permeability of two filter materials under different effective stress and hydraulic gradients. The FWPT was conducted using an automatic triaxial stress path machine manufactured by Geocomp, USA, with a constant head tank connected to the triaxial chamber, as shown in Fig. (6). The specimen was compressed in the triaxial chamber via water cell controller. During the permeability tests, the pore water controller supplied the headwater to the bottom of the specimen. The water flowed through the sample and exited at the drainage line (tailwater) connected to the constant head tank. The water level in the constant head tank was used as a datum.
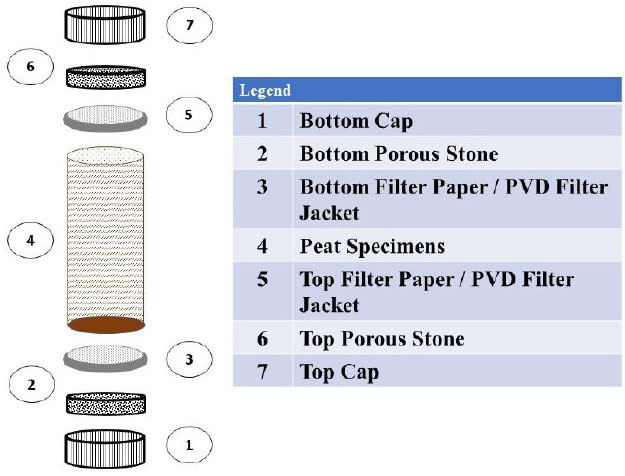
The specimen preparation and test procedure were conformed with ASTM D 5084, Standard Test Methods for Measurement of Hydraulic Conductivity of Saturated Porous Material Using Flexible Wall Permeameter: Method A-“Constant Head” [32]. The dimensions of peat specimens were 38mm in diameter and 150 mm in height. The specimen was initially prepared using a PVD split mold attached directly to a triaxial chamber base. The specimen was then fully submerged in a water tank and loaded with 1 kg piston to pre-consolidate the specimen. After pre-consolidation was completed (which took approximately two hours), the specimen was trimmed to 76mm height. Filter material was placed at the bottom and top of the specimens adjacent to the porous stone (Fig. 7). All the remaining accessories of the triaxial chamber were assembled.
After assembly, the next step was to fill the de-aired water in the chamber. Air trapped was maximally minimized during this filling process. Once filling water was completed, the assembled chamber was placed on the load frame actuator, and the peat specimen was ready for the test.
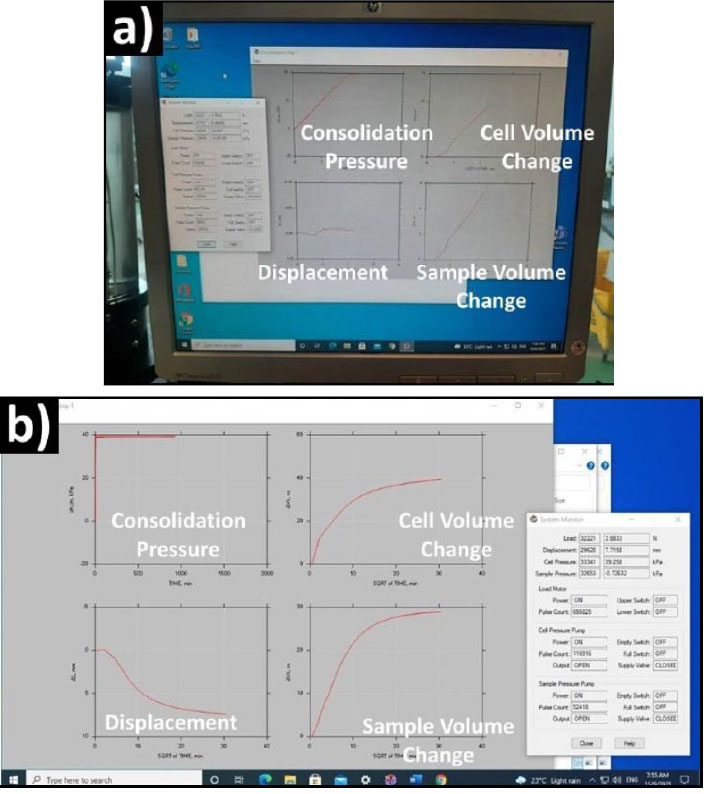
The test consisted of two stages, namely, the consolidation stage and the permeability stage. The consolidation pressure applied varied into targeted pressures of 20kPa and 40kPa. Table 1 lists all tests and their parameters. During the consolidation, chamber water volume change, specimen volume change, and vertical displacement were monitored with time (Fig. 8a). The consolidation stage was terminated when the sample volume showed insignificant change (Fig. 8b); at that point, the excess pore water pressure was zero. The termination of the consolidation test, also after the specimen reached 100% consolidation, was determined by plotting the specimen volume change versus log time. The permeability test began by increasing the sample pressure (connected to the bottom of the specimen) to achieve the target hydraulic gradient. The water flowed through the peat specimens to the constant head tank. The quantity of water flow was recorded with time throughout the test. The permeability stage was conducted in 48 hours. Following the completion of the permeability test, the water content of the specimens was measured, and the void ratio was calculated. Darcy’s Law equation, as specified in ASTM D5084, was used in this study to calculate the coefficient of permeability, kv (m/s).
| Group | Test No. |
Consolidation Pressure, σv’ (kPa) |
Hydraulic Gradient, i |
Average Effective Stress during Permeability, σv’ (kPa) |
|||
|---|---|---|---|---|---|---|---|
| Filter Paper | PVD Filter Jacket | Filter Paper | PVD Filter Jacket | Filter Paper | PVD Filter Jacket | ||
| 1 | 1a 1b 1c |
21.3 18.5 19.9 |
19.2 18.7 19.0 |
6.7 14.2 21.5 |
7.3 14.7 22.0 |
18.8 13.2 11.9 |
16.3 13.05 11.05 |
| 2 | 2a 2b 2c 2d |
39.0 39.2 38.5 39.2 |
39.5 39.0 39.2 39.4 |
7.6 13.8 28.6 47.2 |
8.2 14.7 30.8 52.1 |
36.2 34.1 27.9 21.6 |
36.5 33.5 28.9 21.5 |

4. RESULTS AND DISCUSSION
4.1. Specimen Volume Change
The peat specimens were sorted into two consolidation groups, namely Group 1 and Group 2, using filter paper and PVD filter jacket. The specimens in Group 1 (Fig. 9a and c) were subjected to consolidation under an average pressure of 20kPa for the filter paper, whereas the pressure applied for the PVD filter was 19kPa. In Group 2 (9b and d), the average pressure was 39kPa for the filter paper and 39.2kPa for the PVD filter. The change in sample volume during consolidation was monitored over time, which was illustrated by the volume change graph of peat specimens, as shown in Fig. (9). During the consolidation stage, both test groups indicated an increase in the volume of peat specimens until it reached a plateau state, as indicated by the curve. At this point, the specimens achieved 100% consolidation, and the pore pressure dissipated to zero. The circle on the graph below indicates the termination of the consolidation stage, at which point the permeability test was initiated. A volume change was noticeable in the specimen during the initial stage of the permeability test, but it eventually decreased because of the changing pore pressure applied. The effective stress remained constant during the permeability stage, and a slight volume change occurred, known as the creep behaviour.
4.2. Coefficient of Permeability
Two groups of coefficients of permeability, kv data, which were derived from the FWPT and calculated using Darcy’s Law equation in ASTM 5084, are shown in Fig. (10). The measurements of area and length of the peat specimens were periodically updated to consider creep factor. The curves began with varying kv values and sharply decreased or in a transient state to a certain period, then gradually decreasing as a semi-steady state to the end of the test. Both test groups demonstrated that the kv rate sharply decreased in approximately 90 minutes before slowly decreasing over time in a trend of a negative power function.

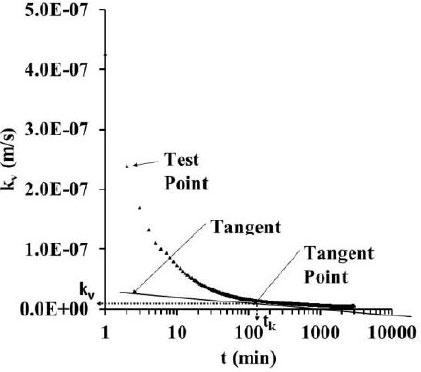
The authors suggested that the kv for the peat specimens’ value is determined via a graphical method, as shown in Fig. (11), beginning where a semi-steady start occurs. After permeability data is extracted from the data logger and plotted into the graph permeability versus time, the approximate straight line is drawn to differentiate the transient and semi-steady states. It is drawn from the gentle curve’s starting point part (inflection point). This straight line is known as a tangent line. Vertically downward extension lines crossing the x-axis represent a time semi-steady state, tk, while the horizontal to y-axis represents a coefficient of permeability determination, kv, for the specific peat specimens. Table 2 summarises the kv and tk measured on peat specimens using two different filter materials, PVD filter jackets and standard filter paper. The summary presents that the kv value of the PVD filter jacket was 2.6 times higher than the filter paper.
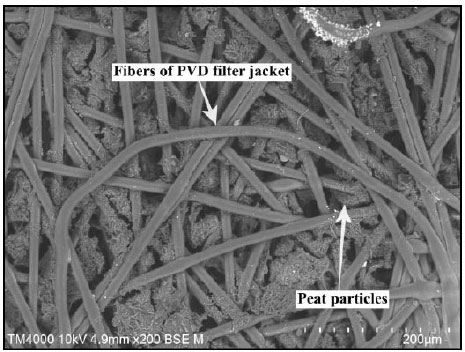
After the permeability test, the filter paper and PVD filter jacket were carefully removed and oven-dried for 96 hours, after which they were visually examined using a scanning electron microscope. The intention was to explore how peat affects the filter jacket and PVD filter. The SEM microphotographs in Figs. (12 and 13) show the presence of fine particles from peat entering the void between the fibers of the filter paper and the PVD filter jacket. The PVD filter showed that a larger void area still remained after the test despite intrusion from peat particles as compared to the filter paper. Accumulation of fine peat particles in the filter material might lead to clogging and a decrease in the kv value during the test. The clogging phenomena was found to affect the kv rate of the filter material [42-44].

| Group | Test No. |
Coefficient of Permeability, kv (m/s) |
Time Obtained to Achieve a Semi-steady State, tk (min) | ||
|---|---|---|---|---|---|
| Filter Paper | PVD Filter Jacket | Filter Paper | PVD filter Jacket | ||
| 1 | 1a 1b 1c |
5.20E-9 7.70E-9 1.00E-8 |
9.58E-9 1.66E-8 1.70E-8 |
345 201 238 |
210 205 206 |
| 2 | 2a 2b 2c 2d |
7.20E-10 3.70E-9 3.70E-9 8.70E-8 |
5.51E-9 4.84E-9 6.27E-9 1.30E-8 |
117 131 214 217 |
157 156 142 154 |
4.3. Permeability Correlations with Hydraulic Gradient
Fig. (14) presents the relationship between Sapric peat initial permeability, kv,i, value and hydraulic gradient, i, using a PVD filter jacket and standard filter paper. The trendline of both filters shows that the hydraulic gradient increases linearly with initial permeability. However, the kv,i and i values of the PVD filter were higher than those of filter paper. It shows that the hydraulic gradient of peat specimens significantly affects the PVD filter jacket compared to filter paper. R-squared, R2, for the PVD filter, was 0.9466, while for filter paper, it was 0.8764. The R2 value representing random error using the PVD filter jacket in this study was less than that of the filter paper. From the statistical analysis, it was found that a linear equation is the best fit among other relationships for this data. The relationship for the current data is proposed in the following equations:
For PVD’s filter jacket:
 |
(1) |
For filter paper:
 |
(2) |
where,
kv,i = initial permeability (m/s)
i = hydraulic gradient
The scatterplot positive direction of the coefficient of permeability, kv, as a function of hydraulic gradient, i, was observed for both filter materials, as shown in Fig. (15). This contrasted with the relationship between initial permeability and hydraulic gradient. No good trend line could be established, although there might be a relationship between these two parameters; whereas the hydraulic gradient increased, the coefficient of permeability increased. Therefore, it appeared that the hydraulic gradient affected the kv,i more significantly rather than the kv.


4.4. Permeability and Time Steady State Correlations with Effective Stress
The relationship between the coefficient of permeability and effective stress is shown in Fig. (16). The observed trend suggests that when the effective stress increases, the coefficient of permeability decreases. The log function is best for establishing a relationship between parameters kv and i. The coefficient of determination, R2, for the Sapric peat specimen, was found to be 0.8553 when using a PVD filter and 0.7479 when using filter paper. The regression analysis indicated that the effective stress parameter was significantly influenced by PVD‘s filter, as opposed to the filter paper. The strong relationship correlation plot demonstrates that the effective stress substantially impacts the coefficient of permeability of Sapric peat.
A linear relationship between the time to achieve a semi-steady state and the effective stress is shown in Fig. (17). The relationship suggests that when the effective stress increases, the duration of the semi-stated condition decreases. The data presented in the figures indicate that the duration required for PVD‘s filter to reach the semi-steady flow state is shorter than the filter paper. This suggests that utilizing PVD‘s filter would result in faster attainment of the semi-steady flow state. The coefficient of determination of R2 was found to be higher when utilizing PVD‘s filter than filter paper, with values of 0.6964 and 0.4362, respectively. The proposed relationship of tk and σ’v can be expressed in the following form:
Relationship using PVD‘s filter:
 |
(3) |
Relationship using filter paper:
 |
(4) |
where,
tk = time semi-steady state (min)
σ’v = effective stress (kPa)
4.5. Coefficient of Permeability Correlations with Void Ratio
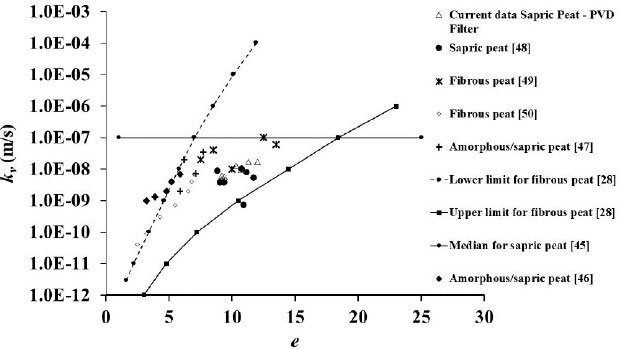
Fig. (18) shows the compilation of the correlations between the coefficient of permeability and void ratio of Sapric and Fibrous peat, as in earlier studies conducted by other researchers. Additionally, the current data of Sapric peat, as provided by the author, is also included in the figure. The overall trend suggests when the void ratio, e, increases, the coefficient of permeability, kv for both Sapric and Fibrous peat also increases. According to Letts et al. [45], the median coefficient of Sapric peat was determined to be 1.0 x 10⁻⁷ m/s. The data obtained using PVD‘s filter indicates that the Sapric peat falls below the median line established by earlier researchers. The observed trend in the data of Sapric peat specimens indicates a positive linear relationship. Specifically, when the void ratio, e, increases, the coefficient of permeability, kv, also increases. This finding is consistent with a previous study by Lea and Brawner [46]. The coefficient of permeability, kv, for Sapric peat, as established by De-Guzman and Alfaro [47], ranged from 3.5 x 10⁻⁸ m/s to 2.0 x 10⁻⁹ m/s. The corresponding current values using the PVD filter were 1.7 x 10⁻⁸ to 4.8 x 10⁻⁹ m/s, which were found to be higher than the findings of Hasan and Janting [48], where the obtained values ranged from 1.0 x 10⁻⁸ m/s to 7.2 x 10⁻¹⁰ when tested Sapric peat using filter paper. The coefficient of permeability data for the current Sapric peat specimens obtained by FWPT fitted within the range established by Mesri and Ajlouni [28] and was closer to the study conducted by Long et al. [49]. The trend data of the present findings aligns with the data published by previous researchers, Hayashi and Hatakeyama [50].

CONCLUSION
The selection of filter material plays a crucial role in ensuring accurate and reliable results, especially when dealing with PVD construction in peat. The objective of this paper was to present the preliminary data on the effect of using two different filter materials on the permeability behavior of Sapric peat. It was concluded from the overall analysis of the current Sapric peat specimens tested through a series of flexible wall permeability tests that the PVD‘s filter jacket produced a better relationship than the standard filter paper. The coefficient of permeability from PVD filter tests was approximately 2.6 times higher than that of the standard filter paper under the same compression. The duration of FWPT required to reach a semi-steady state flow condition of the PVD filter jacket was 0.9 times faster than the standard filter paper.
The method of determining the kv and tk of the Sapric peat specimen is proposed in this study through a graphical method. It has been found that the effective stress, σ’v, of the Sapric peat specimens using PVD’s filter significantly affects the coefficient of permeability, kv, while hydraulic gradient, i, affects the initial permeability, kv,i.
HIGHLIGHTS
• The type of filter material affects the permeability of Sapric peat.
• Testing using a PVD filter results in a higher coefficient of permeability than standard filter paper under the same effective stress.
• The PVD filter requires a shorter time than the standard filter paper to achieve semi-steady state flow under the same effective stress.
LIST OF ABBREVIATIONS
| FWPT | = Flexible Wall Permeability Test |
| FP | = Filter Paper |
| e | = Void Ratio |
| i | = Hydraulic Gradient |
| kPa | = Kilopascal |
| kv | = Coefficient of Permeability |
| kv,i | = Initial Permeability |
| min | = Minute |
| P | = PVD Filter |
| PVD | = Prefabricated Vertical Drain |
| R2 | = Coefficient of Determination |
| t | = Time |
| ti | = Time Initial |
| tk | = Time Semi-Steady State |
CONSENT FOR PUBLICATION
Not applicable.
AVAILABILITY OF DATA AND MATERIAL
The data used to support the findings of this study are included in the article.
FUNDING
This study was funded by the University Malaysia Sarawak with the title: Coupling Effects between Consolidation and Permeability on Clogging Mechanism in Peat, Project ID: F02/GRADUATES/2087/2021, Grant Type: Postgraduate Research Grant.
CONFLICT OF INTEREST
The authors declare no conflicts of interest, whether financial or otherwise.
ACKNOWLEDGEMENTS
The support rendered by Universiti Malaysia Sarawak in facilitating this study is greatly acknowledged.


