All published articles of this journal are available on ScienceDirect.

Assessment of POFA-Pervious Concrete Performance with Oil Palm Shells as a Partial Aggregate Replacement
Abstract
Introduction
In Malaysia today, periods of excessive rain can result in flooding poses a significant challenge. The existing drainage system struggles to manage the wastewater effectively. In addressing the persistent issue of flooding in Malaysia, this issue’s solution was recommended to introduce pervious concrete (PC). Recognizing the urgency of finding sustainable and environmentally friendly solutions, the present study focuses on the application of PC as a potential remedy that allows water to infiltrate through its porous structure.
Aims
Despite the potential benefits of PC, there exists a notable gap in the understanding of its performance, especially when incorporating oil palm shells (OPS) as a partial aggregate replacement in POFA-pervious concrete (PPC). OPS is an agricultural waste material abundant in palm oil-producing regions, remarkably in Malaysia. This research aims to bridge this gap to evaluate the performance of PPC and PPC with OPS. By addressing the performance of PPC at different OPS replacement levels and curing ages, the lack of such detailed investigations in the existing body of knowledge underscores the novelty and importance of this present research.
Methods
Experimental tests were conducted to evaluate the performance of PPC and PPC incorporating OPS comprising density, water absorption, void content, and compressive strength. All the tests were conducted at 7 and 28 days after the hardened concrete was cured in water.
Results
The results revealed that as the OPS content increased, the compressive strength of PPC with OPS decreased but was significantly higher than recommended in the standard. Conversely, the reduction in strength was accompanied by an improvement in water absorption, making PPC encompassing OPS suitable for applications. The void content of the PPC increased with higher OPS replacement levels, indicating an increase in porosity. This increase in porosity led to a decrease in the density of the PPC incorporating OPS.
Conclusion
The findings of this research suggest that the incorporation of OPS as an aggregate replacement in PPC can offer advantages in terms of water absorption. The inclusion of 10% OPS significantly and positively affects the performance of PPC.
1. INTRODUCTION
In recent years, sustainable construction practices and environmental considerations have led to increased interest in the utilization of waste materials as alternative resources in concrete production. Pervious concrete (PC), also known as porous or permeable concrete, has emerged as a promising solution that addresses both stormwater management and environmental conservation [1, 2]. US Environmental Protection Agency also avowed that PC is recognized as a best management practice for stormwater [3]. PC has gained significant attention in recent years due to its unique properties and environmental benefits [4, 5]. Unlike conventional dense concrete, PC exhibits high porosity, allowing water to pass through and infiltrate the ground, thereby minimizing surface runoff and promoting groundwater recharge [6, 7]. This unique property makes PC a valuable tool in sustainable urban development and mitigating urban flooding [8, 9]. However, the PC’s mechanical properties, particularly its compressive strength, remain limited, restricting its range of applications. This study focuses on advancing and characterizing environmentally friendly PCs to enhance their properties. One area of ongoing research and actively looking into with PC is the utilization of waste materials as aggregate replacements [10-13]. The utilization of waste materials, such as industrial by-products, recycled aggregates, and agricultural residues, aligns with the principles of a circular economy, wherein waste is valorized and transformed into valuable resources. This approach contributes to reducing the environmental burden associated with waste disposal and conserving natural resources. By incorporating waste materials into PC, researchers aim to enhance its properties, including permeability, strength, and durability, while minimizing its ecological footprint [14].
To date, numerous research studies have looked into the effects of including waste materials in PCs, investigating their impact on performance [15-17]. This exploration encompasses a wide range of waste materials, including mineral admixtures [18, 19], recycled concrete aggregate [20, 21], plastic waste [22], waste glass [13, 23], crushed shells [11, 24], waste tires rubber [25, 26] and agricultural residues [27, 28], among others. These investigations examine properties like compressive strength, density, permeability, water absorption, and durability. Collectively, these studies contribute to the ever-expanding knowledge of sustainable concrete technology, providing valuable insights into the potential advantages and challenges linked with incorporating waste materials into PCs. Conventionally, the compressive strength of a conventional PC falls within the range of 2 MPa to 28 MPa [29]. The production of conventional PC involves using natural aggregates, which have a significant negative impact on the environment due to extraction, transportation, and processing. A possible solution involves replacing traditional aggregates with waste materials during PC production. Introducing waste materials as substitutes for aggregates in PC offers several potential benefits. Therefore, it is still necessary to research the PC's properties, especially those when employing industrial by-products in replacement for natural aggregate.
For instance, PC containing waste glass have shown comparable compressive strength to conventional PC [13, 23], a finding reinforced by a study [17, 30]. Similarly, utilizing waste seashells as aggregate replacements has a positive influence, promoting strength development in PC compared to the conventional PC [3, 11]. Other researchers also observed that PC combining cockleshell aggregates showed lower compressive strength than reference PC [24, 31]. Liu et al. [32] and Viera et al. [22] noted that PC made with recycled concrete aggregate also exhibited similar strength to conventional PC. In contrast, several researchers discovered that incorporating recycled concrete aggregate led to a lower compressive strength (5 MPa to 15 MPa) than that of conventional PC but showed an increase in void content and porosity [17, 22, 33, 34]. Numerous researchers examined the potential of waste tire rubber as a partial aggregate replacement in PC. Their findings revealed that introducing waste tire rubber reduced the compressive strength of PC [25, 26, 35]. In comparison, PC-containing various types of waste materials as an aggregate replacement (such as engineered biomass aggregate [36], fine copper slag aggregate [37], and acidic pumice aggregate [38]), it was reported that the compressive strength of PC decreased with increasing the replacement level of the waste materials. However, they suggested that seashell waste can be utilized as a partial aggregate in PC for non-structural purposes.
In recent years, researchers have explored the utilization of oil palm shells (OPS), also known as oil palm kernel shells or palm kernel shells, as an alternative aggregate in the making of concrete [39, 40]. OPS exhibits heterogeneity and contains micro-pores on its outer surface, yet these pores offer valuable advantages when used in creating PC [24, 41]. This exploration has illuminated interesting insights, revealing that the compressive strength of PC incorporating OPS tends to decrease as the OPS content increases. Remarkably, even with this reduction, the compressive strength remains well within the acceptable range for PC [42, 43]. Numerous research studies have also examined the impact of OPS as a replacement for aggregate on PC performance [39, 44]. However, the presence of OPS in PC decreased its compressive strength, typically the compressive strength ranging from 5 MPa to 12.9 MPa [24, 30, 41, 45, 46]. The use of OPS in PC also decreased its density with increasing OPS content. The study found that the density of PC-containing OPS might range from 1400 kg/m3 to 1800 kg/m3. These values can significantly vary because OPS is a lightweight aggregate, its inclusion in the PC mixture may lead to a reduction in overall density compared to conventional PC. Moreover, as the OPS content increases and the void content increases [39, 44, 46]. As well-documented in ACI 522R [29], the typical density of conventional PC is in the range of 1600 kg/m3 to 2000 kg/m3, while the void content typically falls between 15% and 35%. However, it is a great feature of a PC that has high porosity and allows water to pass through it easily. As reported by a study [39], parking lots can be made of PC with a compressive strength of 13 MPa and a void content of at least 20%. However, lower compressive strengths may be acceptable for parking lots for light vehicular loads [3, 47]. Based on the findings, it is proven that the inclusion of various types of waste materials to produce PC makes it possible to produce higher compressive strength. However, the recorded compressive strength range was still acceptable and suitable for PC at 28 days [29]. As a result, it is feasible to create a sustainable PC by using waste materials.
Complementary to the disadvantages of OPS in terms of its compressive strength, mineral admixtures have been introduced as a partially blended cement in PC production [48]. A study on the compressive strength of PC increased with the increase in palm oil fuel ash (POFA) content was limited to 30% [8]. This finding was also agreed by Anwar et al. [49] who indicated that PC made with mineral admixture had similar strength as conventional PC. Another study found that the use of POFA as a cement replacement material resulted in a decrease in compressive strength and an increase in the void content of PC [24]. This is because the delayed hydration and slow pozzolanic reaction of POFA prevented the development of compressive strength. In comparison, there was no significant difference between the properties of fly ash-based PC and those samples comprising only cement [50]. Tijani et al. [43] also found that combining sorghum husk ash cement and palm kernel shell aggregate as partial ingredients in PC manufacturing found that the compressive strength of PC decreases as husk ash cement increases.
The development of PC does not stop here, and the utilization of waste materials as aggregate replacements in PC has the potential to promote sustainable and environmentally friendly construction practices. PC containing waste materials as an aggregate replacement can enhance its sustainability without compromising its performance. While existing research has extensively investigated the effects of various waste materials on PC performance, the novelty of this research lies in its specific focus on the combined use of POFA and OPS as partial material replacement. The specific interaction between OPS as partial replacements for aggregate in POFA pervious concrete (POFA-PC) remains an underexplored area, presenting a significant gap in the existing literature. Therefore, the idea to improve the performance of POFA-PC by incorporating OPS as an aggregate replacement was looked into. This research addresses this gap by examining its density, void content, water absorption and compressive strength. It is hoped that the use of POFA and OPS as partial materials replacement in PC will help introduce the idea of sustainable construction.
2. MATERIALS AND METHODS
2.1. Materials
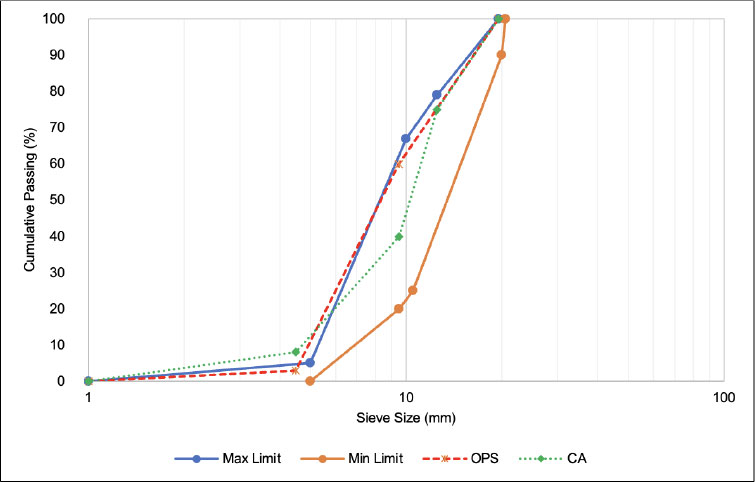
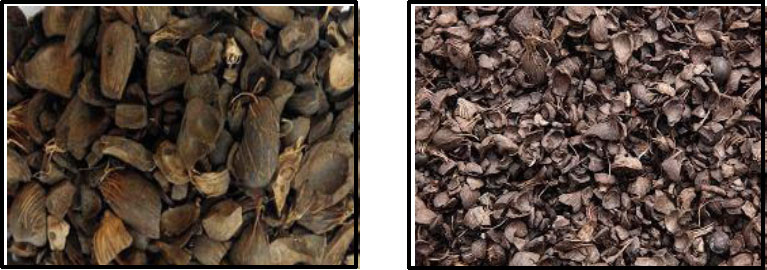
The basic components of ordinary Portland cement (OPC), coarse aggregate (CA), water, and superplasticizer were used. OPC Type I is provided by a YTL Cement is used. The properties of OPC are equivalent to MS EN 197-1 [51]. Crushed gravel provided by a local supplier was used as a coarse aggregate. In this research, palm oil fuel ash (POFA) and oil palm shells (OPS) were also employed as partial replacement materials in the fabrication of PPC specimens. Table 1 lists the chemical composition of the POFA and OPC. The POFA and OPS were obtained from Felda Lepar Hilir, Gambang, Kuantan. The raw OPS needs to be treated by soaking the OPS with a 5% sodium hydroxide (NaOH) solution for 4 hours to reduce the fibers and trace amounts as well as ash content. The leftover NaOH on the OPS particles were then cleaned using tap water, dried and stored at room temperature. A mechanical shaker was used to sieve the coarse aggregate and OPS particles through a 12 mm sieved and retained at a 5 mm size following BS EN 12620 [52]. The characteristics of coarse aggregate and OPS particles are displayed in Table 2. The specific gravity, water absorption, and density of OPS particles obtained are 1.26, 26% and 1259 kg/m3, respectively. When compared to natural aggregates, it was found that the water absorption of OPS particles was about 98.96% higher. On the other hand, the particle density of OPS was 51.98% lower than natural aggregate. Previous researchers have indicated that the specific gravity of OPS particles ranges between 1.17 to 1.62, and water absorption ranges from 14% to 34% [36, 45, 53]. They also found that the density of OPS particles was 53% lower than that of the coarse aggregate. Traore et al. [39] reported that the density of OPS particles was measured at 1340 kg/m3. The particle size distribution of the OPS and CA particles employed in this investigation is shown in Fig. (1). Approximately 55% of OPS particles pass through 10 mm sizes and are retained on a 5 mm sieve. The larger OPS particles appeared parabolic with convex and concave surfaces, while the medium-sized particles were flaky and angular, as shown in Fig. (2). From the results, the OPS used complied with the requirement for aggregate.
| Chemical Composition | OPC (%) | POFA (%) |
|---|---|---|
| Silica, SiO2 | 16.66 | 41.80 |
| Aluminium Oxide, Al2O3 | 3.77 | 9.00 |
| Ferric Oxide, Fe2O3 | 3.33 | 9.00 |
| Calcium Oxide, CaO | 62.93 | 15.10 |
| Potassium Oxide, K2O | 0.85 | 2.60 |
| Magnesium Oxide, MgO | 0.66 | 2.00 |
| Sulphur Trioxide, SO3 | 4.05 | 0.60 |
| Loss of Ignition, LOI | 0.96 | 3.10 |
| Materials | Specific Gravity | Water Absorption (%) | Density (kg/m3) |
|---|---|---|---|
| Coarse aggregate | 2.63 | 0.27 | 2622 |
| OPS | 1.26 | 26 | 1259 |
2.2. Mix Proportioning and Sample Preparation
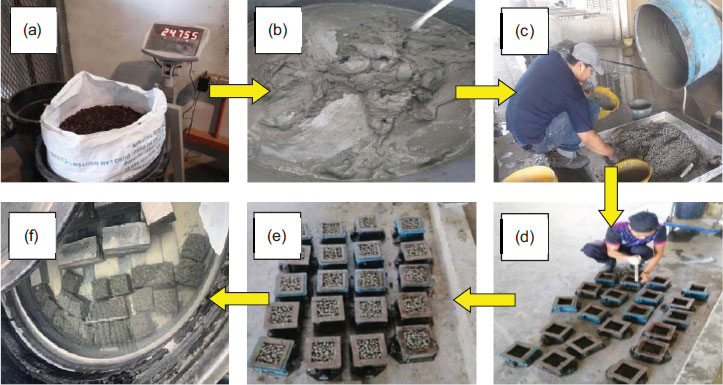
The experimental program involved preparing a series of palm oil fuel ash (POFA) pervious concrete (PC) mixtures with varying percentages of oil palm shells (OPS) replacement. A controlled mixture without OPS was also included for comparison. The mixtures were carefully designed to maintain consistent workability and ensure representative sampling. The process of measuring PC mix ingredients is by weight. The mixing procedures are performed according to BS EN 206-1 [54]. In the mixing of PC, OPC and POFA were poured into a pan mixer. During the mixing, the OPC and POFA were mixed with water uniformly. Next, SP was gently poured and mixed with cement paste until the mix uniformly blended. Initially, coarse aggregate (CA) and OPS were mixed simultaneously until uniform. Subsequently, the PC mix was poured into a steel mould of about a quarter (1/3) of its volume. After that, the steel moulds were placed on a vibrator table to compact the fresh concrete mix. The process was repeated three times until the concrete mixture covered the steel mould volume. Then, the fresh concrete was allowed to harden for up to 24 hours before demoulding and being placed into a curing tank. The basic process of PC mixing is presented in Fig. (3).
| Mix Designation | Raw Materials (kg/m3) | |||||
|---|---|---|---|---|---|---|
| Cement | POFA | CA | OPS | Water | SP | |
| PPC (control) | 441 | 49 | 1470 | 0 | 132.30 | 9.80 |
| OPS10 | 441 | 49 | 1323 | 147 | 132.30 | 9.80 |
| OPS20 | 441 | 49 | 1176 | 294 | 132.30 | 9.80 |
| OPS30 | 441 | 49 | 1029 | 441 | 132.30 | 9.80 |
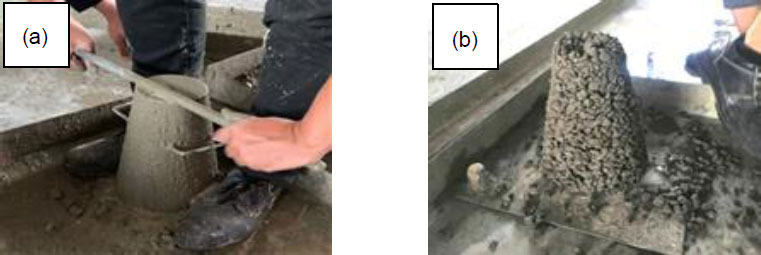
Four (4) series of concrete mix proportions were finalized, namely POFA pervious concrete (PPC) and PPC incorporating three different levels of OPS as a partial aggregate replacement as tabulated in Table 3. A series of PPC with OPS comprised of 10%, 20% and 30% from the weight of coarse aggregate used was produced and designated as OPS10, OPS20 and OPS30, respectively. In this research, 10% POFA was fixed (by weight) as a cement replacement for OPC. Superplasticizer (SP) dosage was also fixed at 2% weight of the binder used. The SP used during concrete preparation is Sika® Visco-Crete® 2199 was supplied by SIKA (M). The water-to-cement ratio used remained constant at 0.27. A low water-to-cement ratio helps achieve the desired porosity by minimizing excess water in the mix, thus contributing to the strength of PC. Concurrently, the incorporation of SP is common practice to maintain the flowability of PC, even with the low water-to-cement ratio. ACI 552R-10 [29] does not have a specific standard slump value for pervious concrete (PC). In this research, the desired slump range for PPC mixes is set between 0 mm to 20 mm, following the approach adopted by a study [1, 55]. The results of this investigation showed that all mixes of the slump readings fell between 13 mm and 20 mm. Fig. (4) demonstrates the slump conducted to measure the concrete workability. Consequently, the fresh PPC and OPS mixes were poured and cast in a 100 mm x 100 mm x 100 mm steel mould after the mixing process. The entire cast specimens were compacted by using a mechanical vibrated machine. The hardened specimens were demoulded after 24 hours and allowed to cure in water for 7 and 28 days before testing was conducted.
2.3. Testing Procedures
In this present research, four (4) tests were conducted to investigate the performance of PPC and a series of PPCs incorporated with different replacement level percentages of OPS. A series of tests were conducted consisting of density, void content, water absorption and compressive strength. All the tests were conducted after the hardened PPC and PPC containing OPS specimens were in the water for 7 and 28 days.
2.3.1. Density and Void Content
The density test was performed for hardened PPC and a series of PPC incorporated OPS follows ASTM C1754/C1754M-12 [56]. Three containers with a volume of 0.0034 m3 were prepared and weighted. The container was filled with fresh PPC and PPC with OPS mixed into mould and compacted. The weight was recorded. The specimens were hardened at room temperature for 24 hours. Next, the hardened specimens were weighed and recorded. The density of hardened PPC and PPC incorporating OPS was determined using Eq. (1).
 |
(1) |
whereby, m is the mass of the mix (kg), and Vol is the volume of the sample (m3).
For the void content test, the 28-day cured PC specimens were taken out from the curing tank and dried for 2 hours at room temperature. Then, the specimens were weighed using a weight scale, and the weight was recorded. After that, the specimens were submerged and weighted underwater. The weight was recorded, and the void content can be determined using Eq. (2).
 |
(2) |
whereby, A is dry weight (kg), B is weight under water (kg), ρw is density of water, and Vol is volume of sample (m3).
2.3.2. Water Absorption
The ASTM C1585 [57] was followed to assess the water absorption of the PPC and PPC-OPS specimens. After curing the specimens for 28 days, the specimen was weighed, and the initial mass was recorded. The specimens were placed in a pan, and tap water was poured until it rose approximately 3 mm above the specimen supports. This water level was maintained throughout the test. Then, a timer was started and the unsealed side of the specimen was kept on the pan supports. The mass of the specimen was recorded at 10-minute intervals for 1 hour. Eq. (3) was used to determine the water absorption of the specimen.
 |
(3) |
whereby, m is the change in specimen mass at the time (kg), a is the exposed area of the specimen (m2), and d is the density of water (kg/m3).
2.3.3. Compressive Strength
For the compressive strength test, the recommen- dations of the standard, BS EN 12390-3 [58] were followed. Three specimens were taken out from the curing tank after being cured at 7 and 28 days. The cured specimens were dried at room temperature before being subjected to a compression test. The compressive strength test was performed on a PPC cube under a 300 kN compressive machine. The load was applied gradually at the rate of 3 kN/sec until the specimens failed. Eq. (4) was used to calculate the compressive strength of hardened PPC.
 |
(4) |
whereby, P is the maximum load (N), and A is the cross-sectional area of specimen (m2).
2.3.4. Respond Surface Methodology
On the other hand, the mathematical equation was conducted using Design Expert Software 13. The response surface model (RSM) was selected due to the suitability of analysis for engineering purposes. Since data for the test mentioned earlier had already been prepared, the best RSM tool to evaluate this study was using historical data analysis. Two variables were selected as control factors which were OPS content and curing age. Those two factors were analyzed in correspondence to four response variables, which were dry density, water absorption, void content and compressive strength. A 3D response surface plot generated using RSM is a graphical representation that helps visualize the interaction between two independent variables (factors) and their combined influence on a response variable.
3. RESULTS AND DISCUSSION
3.1. Density
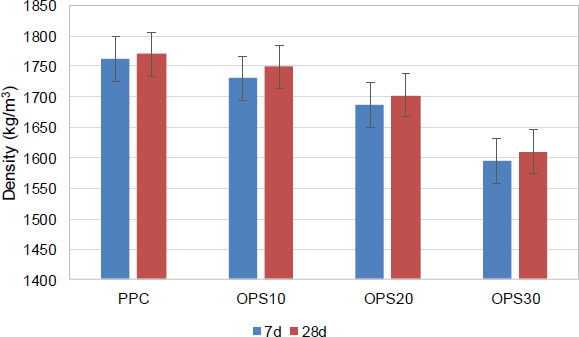
The densities of POFA pervious concrete (PPC) and PPC using oil palm shells (PPC-OPS) as an alternative to aggregate are displayed in Fig. (5). It is revealed that curing age and OPS content in PPC significantly influence the density of PPC. The density for PPC and PPC-contained OPS is improved with prolonged curing days. The decrease in density is relatively moderate but noticeable at 7 days of curing. During the early stage of curing, the cementitious materials undergo hydration, leading to the formation of cement hydrates. There is a continuous drop in density as the OPS content increases when compared to the PPC. The percentage decrease in density ranges from approximately 1.81% for OPS10 to around 10.97% for OPS30 when compared to the PPC. On the 28th day of curing, the trends observed at 7 days continue to be evident, albeit with some variation. The decrease in density becomes more pronounced as the curing period progresses. The percentage decrease in density ranges from approximately 1.13% for OPS10 to about 10.17% for OPS30 when compared to the PPC mix. It can be marked that as the percentage of OPS content increases, there is an observable effect on the density of the PPC, suggesting that the lightweight nature of OPS contributes to lower overall density. Similarly, as the curing age increases, the density tends to increase, potentially due to the ongoing hydration process leading to better particle packing and reduced porosity. However, the results show that all PPC mixes containing OPS exhibit lower density compared to the PPC. This is because the PC mixture may contain voids and spaces between particles, contributing to its porosity. The ongoing hydration leads to the solidification of the PC matrix. The hydrated products bind together particles, forming a more cohesive and dense structure. It is noticeable that the density of PPC containing OPS obtained is within the allowable limit [29]. At 28 days, the density for PPC-based OPS obtained ranged from 1610 kg/m3 to 1749 kg/m3. This range of values is comparable to the values reported in papers researched on PC, which ranged from 1600 kg/m3 to 2000 kg/m3 [1, 38]. PPC that had 10% OPS produced the superior density of all PPC that contained OPS. This reduction aligns with the lightweight nature of OPS aggregates. Because of their porous structure, lightweight aggregates like OPS introduce voids into the PC mixture when OPS is used. These voids decrease the overall density of the concrete [24]. As a result, the lightweight nature of the OPS aggregate affects the density of the entire concrete mixture, contributing to the permeable and lightweight properties of PC [40]. It is important to note that the density of concrete can impact its mechanical properties, such as strength. Generally, PC is designed to have a lower density than traditional concrete, as its porosity allows water to pass through. This property makes it suitable for applications where water infiltration is desired, such as in stormwater management systems and environmentally sensitive areas.
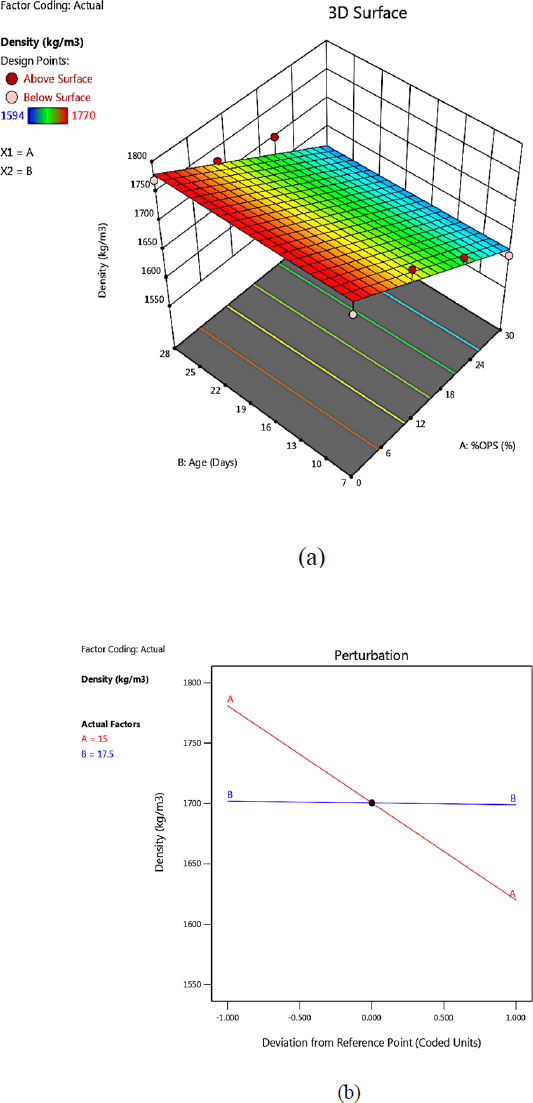
The relationship between the density of PPC to the different percentage levels of OPS and curing ages using RSM is presented in Fig. (6). It demonstrates the density of PPC and PPC-OPS specimens improved with prolonged curing days. However, the density decreased as the level percentage of OPS in PPC increased. This finding is verified by the 3D contour plots in Fig. (6a). The perturbation plot indicates that the content of OPS is partly responsive to the density of PPC. Line A appeared to be noticeably steeper than Line B, as illustrated in Fig. (6b). The steeper slope of Line A (%OPS) on the perturbation plot indicates that changes in the OPS content have a more pronounced effect on the resulting density of PPC-OPS pervious concrete. This implies that altering the percentage of OPS in the mix leads to a more significant change in the overall density of the PPC compared to changes in curing age. This aligns with the inherent lightweight and porous nature of OPS, which contributes to variations in the overall density of the concrete. The linear model provided the best fit to maximize the correlation, as suggested by the RSM. Table 4 shows that the model was highly significant, R2 is 0.9145, indicated by ANOVA. This strong correlation indicates that changes in OPS content and curing age are closely linked to variations in density. The Predicted R2 value of 0.7694 is in reasonably close agreement with the Adjusted R2 value of 0.8803 (less than 0.2). On the other hand, the Adeq Precision measures the signal-to-noise ratio. The Adeq Precision value, measuring the signal-to-noise ratio, was found to be 11.538, indicating a strong signal in relation to noise, suggesting that the model's predictions are reliable and consistent. The linear model by RSM can be used to navigate the design space. The density of PPC and PPC-OPS can be anticipated using the ANOVA equation by varying the percentage of OPS and curing day. From the linear regression, the relation equation between density to OPS content (%) and age (curing day) is shown in Eq. (5).
 |
(5) |
whereby, 1783.55 is the intercept value and constant, A is OPS content, and B is curing days.
| Model | Mean (SD) | Mean | R2 | Adjusted R2 | Predicted R2 | Adeq Precision |
|---|---|---|---|---|---|---|
| Linear | 23.23 | 1700 | 0.9145 | 0.8803 | 0.7694 | 11.5380 |
3.2. Water Absorption
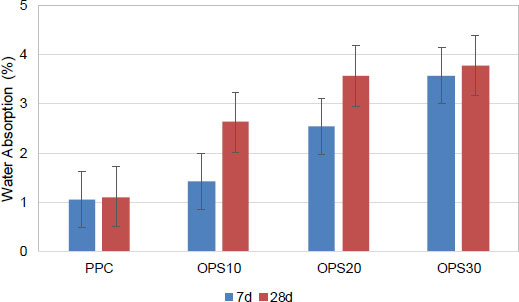
Fig. (7) displays the results of water absorption at 7 and 28 days of curing. It is clear that the water absorption for all mixes gradually increases as the curing time goes from 7 days to 28 days. This is in line with the common behavior of concrete as it continues to hydrate and develop its microstructure over time. During the early stages of curing, it can be marked that PC absorbs water more easily as it continues to hydrate and develop its microstructure. At 28 days of curing, the water absorption of the PPC was 1.10%. The PPC mix containing the highest OPS replacement of 30% achieved the highest water absorption of 3.77% when compared to those of OPS10 and OPS20 (2.62% and 3.46%). It can be seen that a large amount of OPS content has a strong water absorption capacity. It is also revealed that the water absorption values for PPC mixes containing OPS are consistently higher than that of the control mix (PPC) at both curing ages. This indicates that the material's capacity to absorb water is being altered by the presence of OPS in PPC mixes. As more porous OPS aggregates are added, the overall concrete structure becomes more permeable to water [24, 28]. There is no exact standard figure for PC's water absorption, according to ACI552R-10 [24]. Smit [59] discovered that PC mixes with up to 40% cement kiln dust exhibited water absorption rates ranging from 0.86% to 1.72%. The water absorption for fly ash-based PC can be up to 2.54% depending on the amount of fly ash to aggregate used [19]. In contrast, higher water absorption in vibrated pervious concrete using 100% gravel yields 2.4% water absorption after 24 hours, while the lowest content (50%) results in 4.6% [60]. Considering that water absorption of the specimen is high, the level of porosity becomes high whilst the density of the specimen becomes low, and these results align with the findings from this present research. This phenomenon is mainly attributed to the irregularly flaky shaped, angular, and polygonal of the OPS. Besides, the shape of OPS develops in a larger surface area and creates more irregular voids compared to conventional aggregate. Thus, OPS's unique characteristics alter the concrete matrix by introducing irregular voids. The PPC (control mix) consistently meets the standard for conventional PC with water absorption rates well. Notably, OPS10 exhibits lower water absorption compared to those of PPC containing 20% and 30% OPS. This indicates that a PPC mix with 10% OPS content strikes a balance between the benefits of lightweight aggregates and maintaining reasonable resistance to water absorption. While OPS20 and OPS30 mixes provide more lightweight characteristics, they also exhibit higher susceptibility to water absorption due to increased porosity. This can be attributed to the inherent porosity of OPS, which allows water to infiltrate more readily into the concrete matrix. The porous nature of %OPS contributes additional void spaces within the concrete, providing pathways for water to be absorbed.
The influence of OPS content and curing age on improving water absorption potential using RSM is illustrated by the plots in Fig. (8). The 3D response surface plot visually portrays the intricate relationships between OPS content, curing age, and water absorption in PPC as shown in Fig. (8a). It becomes evident that higher OPS content led to increased water absorption in PPC. Similarly, with an increase in curing age, there is a trend of increased water absorption. However, the effect of water absorption is predominant at lower OPS content, indicating that at larger content of OPS, the longer curing age is significant. This statement is confirmed by the perturbation plot in Fig. (8b), which depicts that longer curing age increases the water absorption for PPC and PPC with OPS. It plots illustrated that Line A (%OPS) has a steeper gradient compared to Line B (age), indicating that OPS content had a greater impact on water absorption for PPC with OPS, outweighing the effect of curing age. This highlights the notable influence of prolonged curing age, which is attributed to the ongoing hydration process. The regression models ANOVA yielded that OPS content and curing age, significantly affected the water absorption.
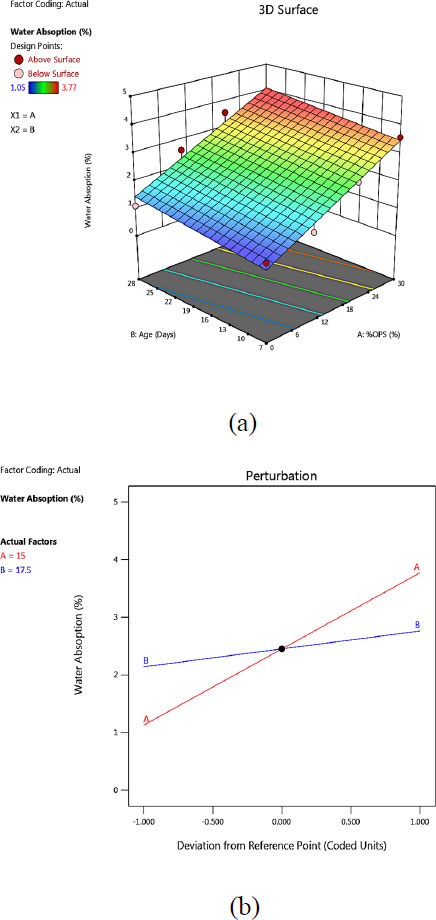
The summary of an ANOVA is tabulated in Table 5. The R2 value of 0.9361 indicates a robust correlation between the factors (OPS content and curing age) and the response (water absorption). This strong correlation means that approximately 93.61% of the variability in water absorption can be explained by changes in OPS content and curing age. Furthermore, the close proximity between the Predicted R2 (0.8255) and the Adjusted R2 (0.9106), with a difference of less than 0.2, demonstrates the model's reliability. The Adeq Precision ratio of 15.626 is indicative of a robust signal-to-noise ratio, the obtained value strongly affirms the model's ability to provide meaningful predictions. Derived from the linear regression, Eq. (6) delineates the relationship between OPS content (%) and curing age (days) concerning water absorption for both PPC and a series of PPC-containing OPS.
 |
(6) |
whereby, 0.610 is the intercept value and constant, A is OPS content, and B is curing days.
| Model | Mean (SD) | Mean | R2 | Adjusted R2 | Predicted R2 | Adeq Precision |
|---|---|---|---|---|---|---|
| Linear | 0.3414 | 2.45 | 0.9361 | 0.9106 | 0.8255 | 15.6260 |
3.3. Void Content
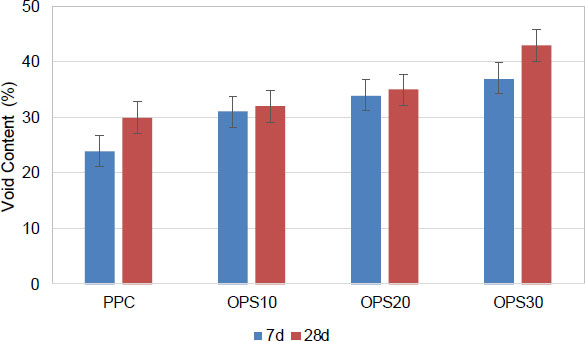
Void content refers to the proportion of empty spaces or voids within a material for both PPC and PPC with various percentages levels of OPS as an aggregate replacement. There is a noticeable percentage increase in void content at 7 days to 28 days for all mix designs, as displayed in Fig. (9). This aligns with the general behavior of concrete as it undergoes the hydration and curing process. As cement particles hydrate, they form a more compact structure, which can reduce the overall void content. In this stage, cementitious (OPC and POFA) particles undergo chemical reactions with water during the hydration and curing process. The reaction generates hydration products that help in the formation of a more compact (denser) and interconnected structure within the concrete matrix. On day 7, the void content for PPC having different percentage levels of OPS content increased by up to 30% compared to the PPC. At 28 days, OPS content's effect on void content remains consistent with the trend observed at 7 days. It can be said that OPS’s unique characteristics continue to impact the concrete matrix, sustaining void content over the extended curing period. When compared to the PPC, OPS10, OPS20, and OPS30 demonstrated void content increments of 32%, 35%, and 42%, respectively. The increase in void content suggests that as the concrete continues to cure, it tends to develop a more open and porous structure. This is often desirable in permeable concrete to enhance its drainage capabilities [40]. The OPS30 mix continues to exhibit the highest percentage increase in void content as compared to those of OPS10 and OPS20, indicating that the influence of OPS becomes more pronounced as curing progresses. It is interesting to note that the OPS10 mix shows a smaller percentage increase in void content compared to OPS20 and OPS30 at the 28 days of curing. The initial increase in void content due to the addition of OPS aggregates might be more pronounced with smaller amounts (OPS10), but as OPS content continues to increase (OPS20 and OPS30), the percentage increase in void content becomes less significant. This could imply that there might be a saturation point or an optimal range of OPS content beyond which further increases might not result in as substantial of an effect on void content. Materials like OPS with flaky and angular shapes and porosity hinder the proper compaction of concrete, leading to more empty spaces and higher void content [45]. It was shown that the void content of PPC integrated 10% and 20% OPS was within the acceptable range of 15% to 35% [24]. The nearly identical void content of PPC containing 10% OPS to that of PPC suggests that the introduction of 10% OPS may not significantly alter the void structure, offering a balance between porous characteristics and practical considerations.
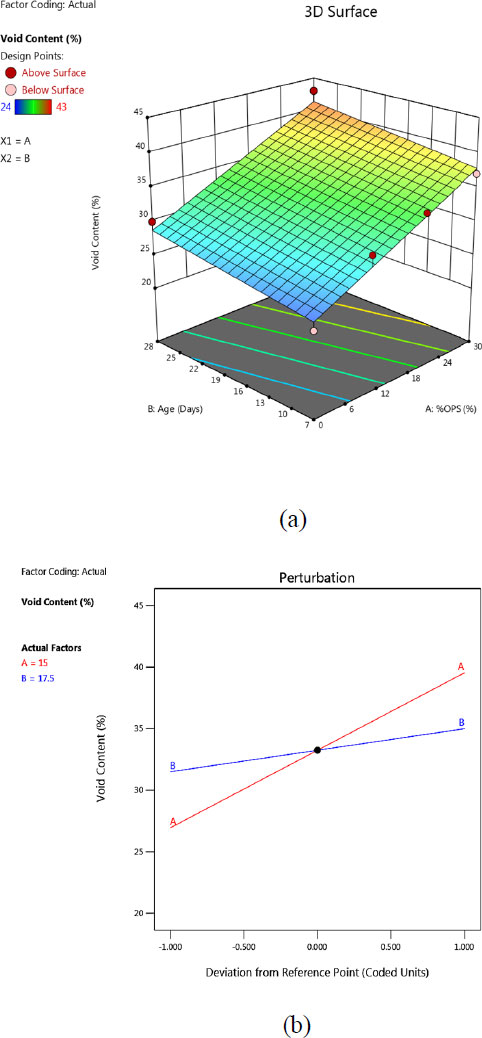
Fig. (10) depicts the relationship between OPS content and curing age against void content in PPC specimens. Fig. (10a) demonstrates that the void content in PPC was influenced by the inclusion of OPS content and curing age. The 3D surface response demonstrates that raising the OPS content results in higher void content for PPC, and similarly, increasing the curing age leads to higher void content. Fig. (10b) shows the perturbation plots to gauge the sensitivity of the tested parameters against response. The perturbation plot created using RSM illustrates that Line A (%OPS) exhibits a steeper gradient compared to Line B (curing age) to void content. This suggests that changes in OPS content have a more pronounced effect on void content than changes in curing age. This could imply that adjusting the OPS content in the mix has a greater influence on void content than varying the curing age. The linear regression was designed by RSM to obtain the best fit for the void content relation with the percentage of OPS and curing age. As shown in Table 6, it indicates that the relationship between void content and those parameters is strong where R2 is 0.9323. The difference between the Predicted R2 (0.8178) and the Adjusted R2 (0.9052) is less than 0.2, which is a reasonable agreement. In addition, the Adeq Precision ratio found to be 15.386 indicates a satisfactory signal (a ratio above 4), confirming the model can be used to navigate the design space. The empirical relationship between void content and multiples factor (%OPS and curing age) is expressed by the following equation and presented in Eq. (7).
 |
(7) |
whereby, 24.033 is the intercept value and constant, A is OPS content, and B is curing days.
3.4. Compressive Strength
The compressive strength of PPC and a series of PPC incorporating various percentage levels of OPS are presented in Fig. (11). It is found that the compressive strength tends to increase from 7 days to 28 days for all mix designs. The increase in compressive strength with curing age is attributed to the ongoing hydration process. While the general trend shows an increase in compressive strength with curing age, the rate of strength development varies among different mix designs. As the OPS content increases up to 30%, there is a consistent decrease in compressive strength at both 7 days and 28 days curing ages. This is because OPS particles interfere with the proper interlocking and packing of PPC, leading to a less dense and weaker overall structure. As a result, the negative impact on PPC compaction outweighs the positive effects of hydration as the percentage of OPS content increases, the compressive strength decreases continually.
| Model | Mean (SD) | Mean | R2 | Adjusted R2 | Predicted R2 | Adeq Precision |
|---|---|---|---|---|---|---|
| Linear | 1.71 | 33.25 | 0.9323 | 0.9052 | 0.8178 | 15.3838 |
At day 28 of curing, the compressive strengths for PPC, OPS10, OPS20, and OPS30 were 13.22 MPa, 12.07 MPa, 9.05 MPa, and 5.92 MPa, respectively. It can be noted that PPC with OPS exhibits lower strength compared to PPC. The OPS10 mix exhibits a slight decrease of about 8.69% in compressive strength compared to the PPC. This indicates that the inclusion of 10% OPS in PPC has a relatively minor impact on strength reduction at 28 days. On the contrary, the OPS20 and OPS30 mix experiences the most significant reduction in compressive strength, with reductions of approximately 31.49% and 55.19%, respectively, compared to PPC. Yet again, this is due to the OPS particle shape significantly interfering with proper particle interlocking, resulting in a less dense PPC matrix. The compressive strength reduction with higher OPS content suggests that OPS aggregates might contribute to lower strength characteristics in the resulting concrete. This is because compressive strength is highly dependent on the compactness and interconnection of PPC particles. OPS’s unique shape and porous nature disrupt the normal compaction process leading to a weaker overall concrete structure. The lightweight and porous nature of OPS aggregates could lead to less efficient load-bearing structures and weaker concrete, as reflected in the reduced compressive strength [38, 39]. The lower
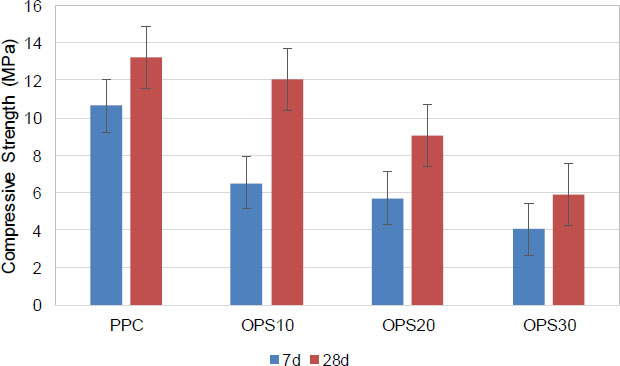
compressive strength values in mixes with higher OPS content could be related to the increased void content and reduced densification due to OPS aggregates. However, the OPS10 mix has relatively lower strength values, suggesting that even a small amount of OPS content can significantly impact compressive strength. According to ACI 522R [24], the compressive strength results for permeable concretes with natural aggregates are typically between the limits of 3.5 MPa to 28 MPa. Therefore, the entire PPCs containing OPS still maintain a reasonable level of compressive strength, considering the permeable nature of the PC. It is noted that the compressive strength of PPC incorporated 10%, 20% and 30% OPS was within the range and comparable to the results obtained from those previous researchers [38-40, 42-44]. It clearly marked that OPS10 is close to what was expected.
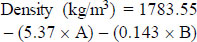
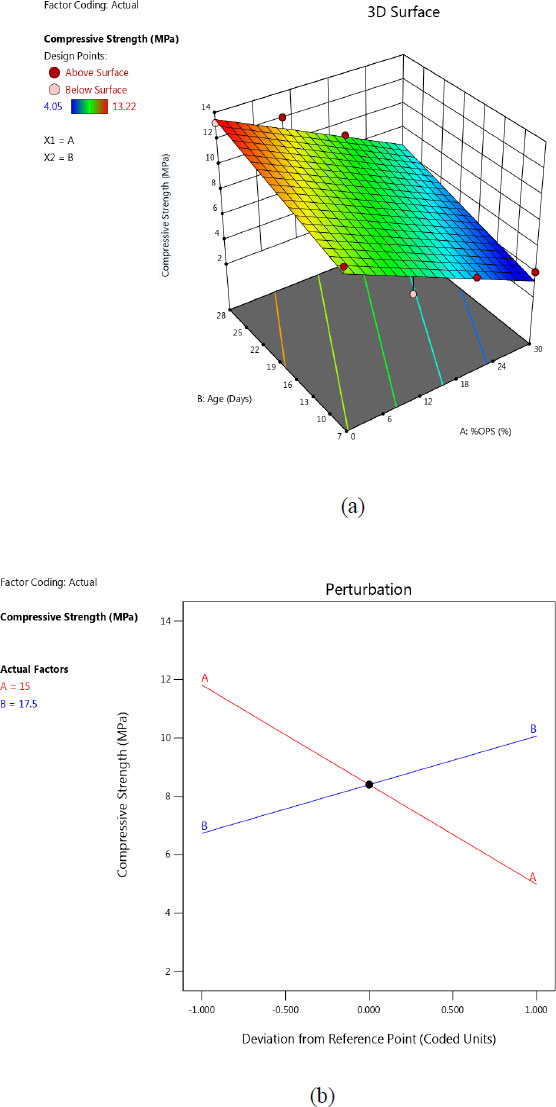
The 3D response surface model on the relationship between factors (OPS content and curing age) against response (compressive strength) is presented in Fig. (12). The plots in Fig. (12a) clearly show that varying OPS replacement levels and curing days impact on PPC’s compressive strength. Among the factors of OPS content and curing age, the RSM suggested that OPS content has a more dominant influence on enhancing the compressive strength of PPC-OPS mixes. This statement is supported by the perturbation plots in Fig. (12b). It shows the interaction plots between the factors, percentage of OPS content (Line A) and curing age (Line B). The steepness for Line A is more steeper than Line B, indicating the OPS content was more sensitive compared to curing age, and significance influences the compressive strength of PPC-OPS. This observation might seem contradictory to the previous statement. This discrepancy could arise due to OPS content could indicate that changes in replacement percentage levels for OPS have a more significant impact on compressive strength compared to curing age. It indicates that changes in OPS content have a relatively stronger influence on compressive strength compared to variations in curing age. Table 7 shows a summary of ANOVA in determining the interaction between OPS content and curing age to the compressive strength of PPC specimens. It was observed that the linear model, as suggested by RSM, has a strong linear relationship where the R2 was found to be 0.9492. This indicates that the variation in the factors (A and B) contributes to 94.92% of the variation in compressive strength. The predicted R2 of 0.8178 shows good alignment with the adjusted R2 of 0.9052, with a difference of less than 0.2. As a result, the predicted models can be used to navigate the design space where the Adeq Precision obtained from ANOVA is 15.386, indicating sufficient signal. This model can be used to navigate the design space. The empirical relationship between factors (%OPS and curing age) versus compressive strength is expressed by the linear equation in Eq. (8).
 |
(8) |
Whereby, 1783.55 is the intercept value and constant, A is OPS content, and B is curing days.
| Model | Mean (SD) | Mean | R2 | Adjusted R2 | Predicted R2 | Adeq Precision |
|---|---|---|---|---|---|---|
| Linear | 0.8905 | 8.40 | 0.9492 | 0.9289 | 0.8726 | 18.6406 |
3.5. Interaction between Density, Void Content and Compressive Strength
The relationship between density and void content against compressive strength of PPC and PPC incorporating OPS is presented. Table 8 shows the summary of model validation of factors (void content and density) that influence the compressive strength of concrete using RSM. The F-value for the model is 7.60, indicating that the model is significant. This indicates that the factors being investigated have an impact on the compressive strength of the concrete. Among the factors examined, it was observed that, in contrast to density, void content does not significantly affect the compressive strength of the concrete in the tested range compared to density. The positive aspect lies in the confirmation of the model’s validity through statistical significance. As observed, the P-value obtained for the void content parameter is greater than 0.10. Therefore, density has contributed to an increase in the compressive strength of the concrete. It is interesting to note that the density of PPC plays an important role in contributing to increased compressive strength. This insight could be valuable in optimizing mix designs for PC, emphasizing the importance of controlling density for desired strength outcomes. It can also be confirmed by the accuracy presented by R2. From the ANOVA (Table 9), it was observed that the linear model, as suggested by RSM, has a strong linear relationship where the R2 was found to be 0.7526. This means that the variation of density and void content corresponding to the compressive strength of concrete was about 75.26%. A small value of standard deviation (SD) showed a positive indication of the accuracy and consistency of the data. Adeq Precision also
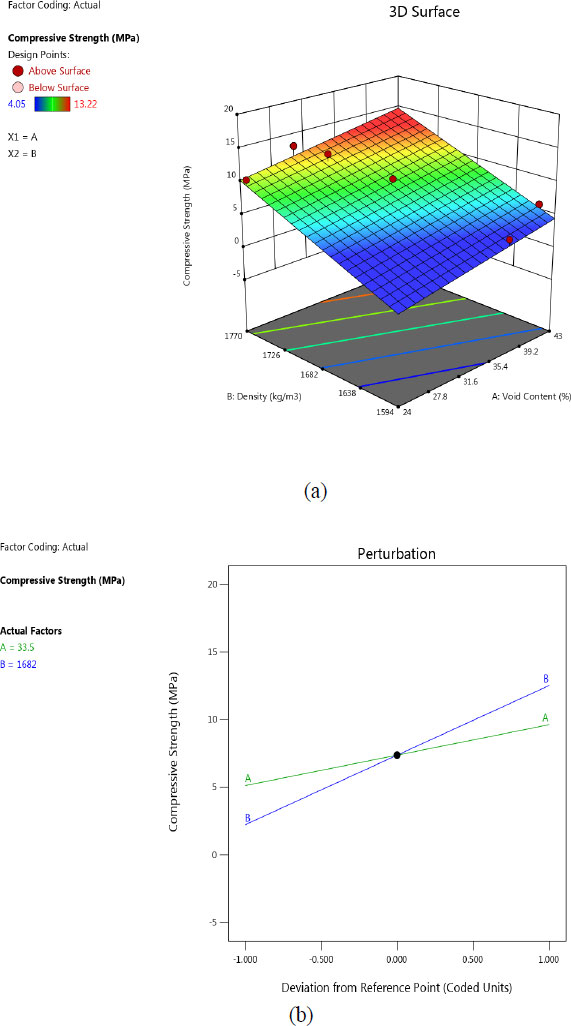
contributes to evaluating the overall performance of the when the value obtained is greater than 4. Fig. (13) portrays the 3D response surface plots on the relationship between density, void content, and compressive strength of concrete. Fig. (13a) demonstrates a linear relationship between density and void content versus compressive strength. It can be seen that the compressive strength decreased, corresponding to the decreased density, resulted in an increase in the void content of concrete. This finding is comparable to a stud [61, 62]. Fig. (13b) shows the perturbation plots to compare the individual effect of those factors to the response. A steep slope in the plot indicates that Line B (density) is steeper than Line A (void content). Therefore, Line B (density) is more sensitive to the response, indicating that the increase in compressive strength is affected by the increase in density compared to void content. The mathematical model between factors and response can be expressed by linear equation, as shown in Eq. (9).
 |
(9) |
whereby, –98.9389 is the intercept value and constant, A is void content, and B is density.
| Source | Sum of Squares | df | Mean Square | F-value | p-value | Remark |
|---|---|---|---|---|---|---|
| Model | 58.74 | 2 | 29.37 | 7.60 | 0.0304 | significant |
| A-Void Content | 3.4 | 1 | 3.4 | 0.881 | 0.3910 | |
| B-Density | 30.33 | 1 | 30.33 | 7.85 | 0.0379 | |
| Residual | 19.31 | 5 | 3.86 | - | - | |
| Cor Total | 78.05 | 7 | - | - | - |
| Model | Mean (SD) | Mean | C.V% | R2 | Adeq Precision |
|---|---|---|---|---|---|
| Linear | 1.97 | 8.40 | 23.40 | 0.7526 | 7.1752 |
CONCLUSION
The utilization of waste materials as aggregate replacements in POFA-pervious concrete has shown promising results in terms of sustainable construction practices and resource conservation. Through the experimental program conducted, the following conclusions can be drawn:
1. The study revealed that higher OPS content generally corresponds to increased void content, impacting density and water absorption. While the OPS10 mix demonstrated relative proximity to the desired water absorption threshold, OPS20 and OPS30 mixes exhibited greater changes.
2. Compressive strength analysis highlighted the influence of both OPS content and curing age. OPS content consistently correlated with reduced compressive strength. However, curing age emerged as a dominant factor, consistently enhancing compressive strength across all mixes over time. The use of 10% OPS in PPC consistently improves strength and remains within an acceptable range that is suitable for some applications.
3. The RSM perturbation plots highlighted the varied effects of OPS content and curing age on responses (density, water absorption, void content and compressive strength). Notably, PPC-OPS performance is significantly impacted by OPS content.
4. Regression modelling and ANOVA statistical analysis offer validity to results and enable the development of prediction correlations between variables.
5. Overall, it can be identified that the inclusion of 10% OPS in POFA-pervious concrete exhibits superior performance and is within the acceptable range for limited use.
6. The study offers valuable guidance for optimizing PPC-OPS compositions to meet specific application requirements. Further research could explore additional additives or mix adjustments to refine the balance between permeability and strength, advancing the field of environmentally conscious and high-performing concrete materials.
HIGHLIGHTS
• The inclusion of OPS in POFA PC increased the void content, density and water absorption performance.
• The inclusion of OPS in POFA PC decreased the compressive strength but remained within an acceptable range for limited use.
LIST OF ABBREVIATIONS
| PC | = Pervious Concrete |
| POFA | = Palm Oil Fuel Ash |
| OPS | = Oil Palm Shell |
| PPC | = POFA Pervious Concrete |
| PPC-OPS | = POFA Pervious Concrete Containing Oil Palm Shellc |
| SP | = Superplasticizer |
| CA | = Coarse Aggregate |
| RSM | = Response Surface Model |
| ANOVA | = Analysis of Variance |
CONSENT FOR PUBLICATION
Not applicable.
AVAILABILITY OF DATA AND MATERIAL
The data supporting the findings of the article is original and has not been deposited in an external repository. All original data is available upon request from the corresponding author [M.J].
FUNDING
This study was funded by the Universiti Malaysia Pahang Al-Sultan Abdullah, Funder ID: Fundamental Research Grant (RDU), Awards/Grant number: RDU220312.
CONFLICT OF INTEREST
The authors declare no conflict of interest, financial or otherwise.
ACKNOWLEDGEMENTS
The support provided by Universiti Malaysia Pahang Al-Sultan Abdullah for this study is highly appreciated.

