All published articles of this journal are available on ScienceDirect.

Study on the Interaction Mechanism of Segments in the Stratum of TBM Tunnels Undercrossing Existing Buildings
Abstract
Introduction
Surface settlement caused by tunnel excavation is an inevitable phenomenon in urban subway tunnel construction, which may cause irreversible damage to the ground roads, buildings, etc., if not controlled. Therefore, reasonable prediction and control of surface settlement are essential to ensure the safety and efficiency of tunnel construction.
Methods
Based on the numerical analysis method, this paper establishes a three-dimensional mechanical calculation model of a TBM tunnel (diameter 6 m) crossing existing buildings (4-story frame structure) and studies the influence law of tunnel excavation on stratum deformation and segment stress.
Results
The results show that (1) the stress and displacement of the segments vary with the position, and the segments under the building are most affected by the building, whose vertical stress is much greater than the horizontal stress. (2) The vertical displacement of the segments is the largest at the vault and arch bottom and increases with the segments approaching the building, while the horizontal displacement is the largest at the arch waist and shows negative values along the tunnel axis. (3) When the tunnel is excavated to a distance of one tunnel diameter from the building, the building will be affected. If the stratum is unstable, it may cause the collapse of the excavation face or surface settlement, which may result in building inclination, cracking or uneven settlement.
Conclusion
The research results of this paper can provide a reference for the construction parameter optimization and risk control of TBM tunnel crossing existing buildings.
1. INTRODUCTION
When excavating underground rail transit tunnels, the load on the upper part of a segment changes, which alters the original equilibrium state of the soil [1-4]. The planned route of rail transit often passes through busy urban areas with a dense population, heavy traffic, and numerous buildings. It is inevitably affected by buildings and surrounding rock soil. When the soil settlement reaches a certain point, it can have irreparable effects on the safe use of surface buildings or structures [5]. When the tunnel construction crosses an existing road, if the stratum settlement is not effectively controlled, the road surface sinks and collapses, causing accidents and traffic paralysis. Stratum deformation caused by excavation is indirectly intensified by the upper load and transmitted to the segment through the surrounding rock of the formation. Carelessness in the construction process threatens the safety of construction personnel, urban residents, and properties [6]. Formation deformation is a direct cause of the destruction of surface roads and structures in an underpass project. Currently, the commonly used tunnel excavation methods include the new Austrian tunnelling, shield tunnelling, and shallow buried and concealed excavation. However, regardless of the method, the original equilibrium state is inevitably destroyed, producing a secondary stress field due to the change in surrounding rock stress and resulting in consolidation deformation of soil and surface settlement. Geological conditions, supporting measures, construction technology, and tunnel section shape affect the settlement mode and amount of settlement. Reasonable prediction of surface settlement can effectively guide tunnel construction and optimise the design.
Researchers have extensively studied the ground deformation behaviour of segments in subway tunnel construction. The influencing factors of foundation reaction, apparent shear modulus of foundation, apparent stiffness of support, and interaction curves have been studied [7]. The effects of the in situ stress ratio on the stress path, stress cracking, and ground reaction curve of the tunnel arch have been studied through numerical analysis, and the effectiveness of the program has been verified. The deformation law and mechanism of a new subway tunnel passing through existing objects have been studied, effective control measures have been comprehensively analysed, and optimised construction methods and support measures have been proposed [8, 9]. These literature studies have focused on the influencing factors and deformation laws of tunnel construction but have not conducted an in-depth analysis and discussion on the influencing factors and deformation laws of segment stress. In a previous study [10], the failure modes of the excavation face of a single tunnel and an existing tunnel were investigated using a transparent soil model test and numerical simulation. It was found that the failure mode of the single tunnel was spherical failure due to soil arching, and the failure mode of crossing the existing tunnel was wedge failure. The surface settlement of the crossing of the existing tunnel was considerably reduced, indicating that the existing tunnel decreased the surface settlement. An innovative simulation technology that combines the computational efficiency of detailed process-oriented finite element simulations (sub-model) and element models (surrogate model) was developed in a study [11]. The simulation results demonstrated that the proposed hybrid modelling method was effective. In another study [12], the influence of the transverse range of the tunnel section on tunnel convergence was studied using the FLAC3D finite difference software. Then, a synthesis function was proposed to obtain the minimum cross-sectional area within a given error range. After simulating several types of rocks, a general model with a minimum cross-sectional area was proposed.
In a previous study [13], an analytical method was proposed to study the response of existing tunnels to new tunnel excavation. With little research on the influence of foundation pit excavation on existing double-track tunnels underneath, 26 domestic engineering examples of foun- dation pit excavation and unloading of subway tunnels were analysed. A modified empirical formula for the maximum uplift value was proposed for double-track tunnels in soft soil, and the relationship between the maximum uplift value and unloading rate of double-track tunnels with different skew widths was determined. Based on the Beiheng tunnel project, the influence of the viaduct box culvert foundation pit construction on the hyperbolic metro tunnel of Shanghai Metro Line 13 was analysed [14]. Furthermore, the influence of different excavation methods on the double-track tunnel was discussed, the maximum uplift value for the double-track tunnel based on the proposed modified empirical formula was predicted, and construction suggestions for tunnel deformation control were presented. These three papers studied the experimental verification method of tunnel construction but did not conduct an in-depth analysis and discussion on the influencing factors and deformation laws of segment stress. A three-dimensional numerical analysis model of a shield tunnel segment reinforced with a steel plate was established using a finite element numerical simulation method in a study [15]. Subsequently, a numerical simulation test of the segment reinforced with a steel plate was designed and conducted. The stress distribution in the connection interface between the steel plate and segment with staggered joints was analysed, and the force transfer mechanism between the steel plate and segment was determined. Finally, recommendations for the reinforcement of shield tunnels were proposed. In a study [16], based on the displacement-controlled Schwarz alternating method, theory of complex functions, and elliptic convergence deformation boundary condition around a tunnel, a calculation method for the surrounding strata deformation caused by excavation of a double-line shield tunnel with an arbitrary layout was proposed. In summary, we can see that there are many deficiencies and gaps in the existing literature on the influence laws of tunnel construction on stratum deformation and segment stress.
This study focuses on the deformations of the segment stress and stratum of tunnel boring machine (TBM) tunnels undercrossing urban buildings. A single tunnel undercrossing a single building was established as the model. The stress displacement deformations at different positions of the vault, arch waist, and arch bottom were analysed for different groups of segments, and the stratum deformation and settlement were evaluated at different tunnelling stages.
2. METHOD (NUMERICAL CALCULATION MODEL AND METHODS)
2.1. Project Overview
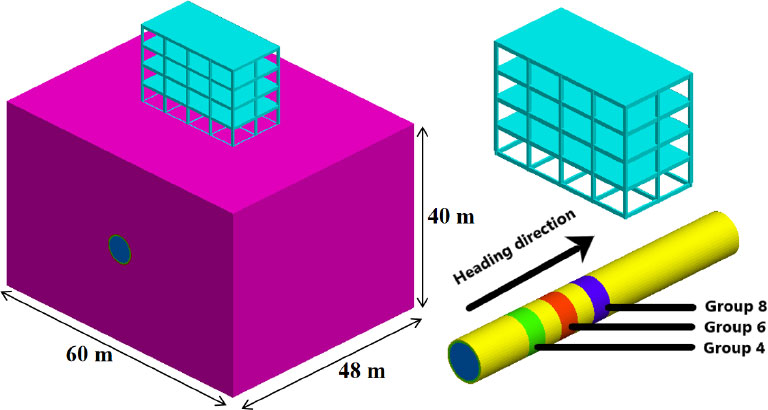
The Xiaocun Station–Nanling Station section line runs north along Renmin Road to the intersection of Renmin Road and Ruichang Road. The current width of Renmin Road is approximately 20 m, and the planned road width is 40 m. The interval line is mainly located below Renmin Road, and many old residential buildings and shops, approximately 1–9 floors high, exist on both sides of the road. Renmin Road is an urban trunk road with ground vehicles and heavy traffic. A large number of pipelines for heating, power, gas, internet, telecommunications, cable TV, sewage, rainwater, tap water, etc., are buried at a depth of 1–3 m. The tunnel depth is approximately 25–36 m. The area is a denuded hilly landform with slight fluctuations and an elevation of 26–36 m. The construction section of the TBM interval is 964.25 m (mileage: ZSK40 + 795.550–ZSK41 + 759.800) with 960.798 m right line (mileage: YSK40 + 795.550–YSK41 + 756.348), extending north along Renmin Road to the intersection of Renmin Road and Ruichang Road and entering Nanling Station. The TBM tunnel has a standard single-hole, single-line circular section. The interval plane line consists of a linear section, two circular curves, and relief curves with radii of 400 m and 800 m, respectively, with a line spacing of 14–16 m, soil thickness of 28–36 m, and a line of 21%. Further, six buildings in this section, numbered 1–6, were simulated. The plane positions of the new tunnel and building group are shown in Fig. (1).
2.2. Numerical Calculation Model and Analysis Method
2.2.1. Model Establishment
The model configuration was 4 spans × 2 spans × 4 layer frame structures, with 2 spans in the tunnel axis direction and 4 spans per 6.5 m. The foundation was 4.2 m, and the foundation for the crossbar was 6.5 m high. The beams, columns, and floors were made of reinforced concrete. The beam section size was 0.3 m × 0.5 m, the column section size was 0.4 m × 0.4 m, and the floor thickness was 0.12 m. According to the TBM construction characteristics of Qingdao Metro, the parameters of the TBM construction and material were as follows: tunnel buried depths of 20 m and 6 m and concrete sheet thickness of 0.3 m and 0.15 m. The soil layer was homogeneous medium-weathered granite. The physical and mechanical parameters are listed in Table 1, and the three-dimensional numerical model of one tunnel foundation building is shown in Fig. (1).
| Material Name | Density (kg/m)3) | Poisson Ratio | Elastic Modulus (MPa) | C (kPa) | Φ(°) |
|---|---|---|---|---|---|
| Plain fill fill | 2000 | 0.35 | 37 | 11 | 30 |
| Moderately weathered granite | 2750 | 0.3 | 5000 | 3000 | 45 |
| C50 Tube | 2500 | 0.21 | 20000 | / | / |
| Grouting layer | 2100 | 0.23 | 1000 | / | / |
| Beams, plates, and columns | 2400 | 0.21 | 20000 | / | / |
The model dimensions were 60 m (x-direction) × 48 m (y-direction) × 40 m (z-direction), and the displacement boundary conditions were as follows: horizontal displacement was limited on the sides, and the upper and lower surfaces of the model had free boundaries. The Drucker–Prager soil strength criterion was used, with a hexahedral solid unit, frame beam, column floor, and tunnel segments. The soil formation used the Moore-Oullen model. The pressure was 0.3 MPa without the friction of the TBM and surrounding soil [17-20]. The following software was used to build the ANSYS model to create the finite element model and set the boundary conditions and initial stress, and FLAC3D, which was used to import the ANSYS model and perform the excavation calculation and simulation analysis [21-23].
2.2.2. Simulation Calculation Process
The construction process for the complex TBM tunnel was simplified to palm surface excavation, transmission of soil slag, installation of pipe sheet structure, and gap grouting between the pipe sheet and stratum. After excavation of the palm surface, installation, exchange, and completion of the structure, a gap was provided between the assembled structure and the formation. The purpose was to build a bridge between the formation and structure so that the surrounding rock and structure could be combined. The surrounding rock on the outer wall of the tunnel was squeezed into the reserved gap [24, 25]. As the tunnel passed, the disturbed surrounding rock was consolidated, resulting in deformation of the surrounding rock near the tunnel and redistribution of the formation. To reduce deformation, grout was pressed into the grouting hole through the pipe space.
The numerical analysis process is as follows:
(1) The boundary condition model restricts the normal displacement, and the soil at the top of the model is the free surface.
(2) The initial ground stress setting considers vertical acceleration due to gravity (9.8 m/s2). The calculation accuracy is 0.0001, and tunnel excavation simulation is conducted after self-weight stress calculation.
(3) In the excavation method, the shield tunnelling method inlet ruler is 1.5 m. Owing to the long length and the hard lower rock layer, the excavation lining is laid once every 3 m to save calculation time. In this simulation, the left tunnel is excavated before the right tunnel.
(4) The pipe sheet concrete strength grade is C50, the pipe sheet thickness is 300 mm, and the post-wall grouting concrete thickness is 150 mm.
3. RESULT AND DISCUSSION
3.1. Analysis of Numerical Calculation Results
The stress in the structure was related to its location. Since the pipe piece was an assembled structure, its force changed with the excavation. The piece was 1.5 m long; one ring and two rings were in one group. Pipe pieces at different positions were selected for stress analysis of the structure. The eighth (21–24 m directly below the building), sixth (15–18 m directly below the building), and fourth group of segments (9–12 m in front of the building) were selected for analysis. The results were displayed using curve drawings.
3.2. Case 1: Structural Stress and Deformation of Group 4 Pipe Piece
The stress and deformation of a group of segments located at an excavation diameter D (d = 6 m) under the building structure were considered. The segments were located 6 m in front of the building. The seventh and eighth ring segments were excavated. When the tunnel was excavated to the front of Group 4, the segment structure of Group 4 was not stressed. Thus, in Group 4, the structure worked after excavation to the fourth loading step.
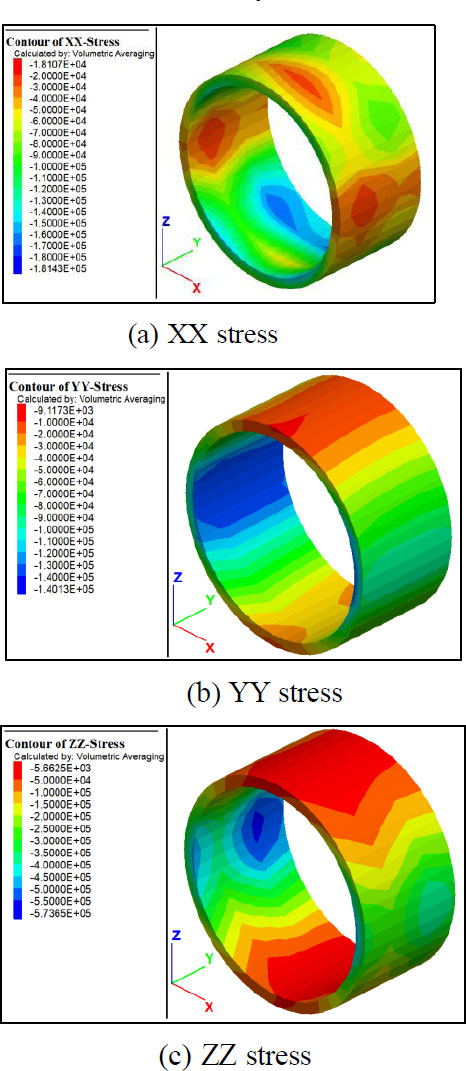
Fig. (2) depicts the stress nephograms of Group 4 after the completion of tunnel excavation. In Fig. (2a), the stress of the segments in the x-direction is negative, and the maximum stress reaches 0.181 MPa at 45° inclination on the left and right sides of the arch bottom. Fig. (2b) shows that the stress in the y-direction is also negative, and the maximum stress reaches 0.14 MPa at the arch waist on both sides. In Fig. (2c), the stress in the z-direction is negative, and the maximum stress reaches 0.57 MPa in the arch waist on both sides of the segment.
Fig. (3) displays the stress curves of the vault, arch waist, and arch bottom outside the segment during tunnel excavation. The data collected after 9 m of excavation are the stress data outside the segment. Fig. (3a) shows that the absolute value of the stress in the x-direction is the largest. The stress immediately after the segment is laid reaches 67 kPa, whereas the stresses in the y- and z-directions are almost the same. In Fig. (3b), the stress in the z-direction of the arch waist is the largest, followed by the stresses in the y- and the x-directions. The stress at the arch waist increases slowly with increasing excavation. In Fig. (3c), the highest stress is in the z-direction arch bottom. The stress differences in the three directions are not large and decrease with increasing excavation.
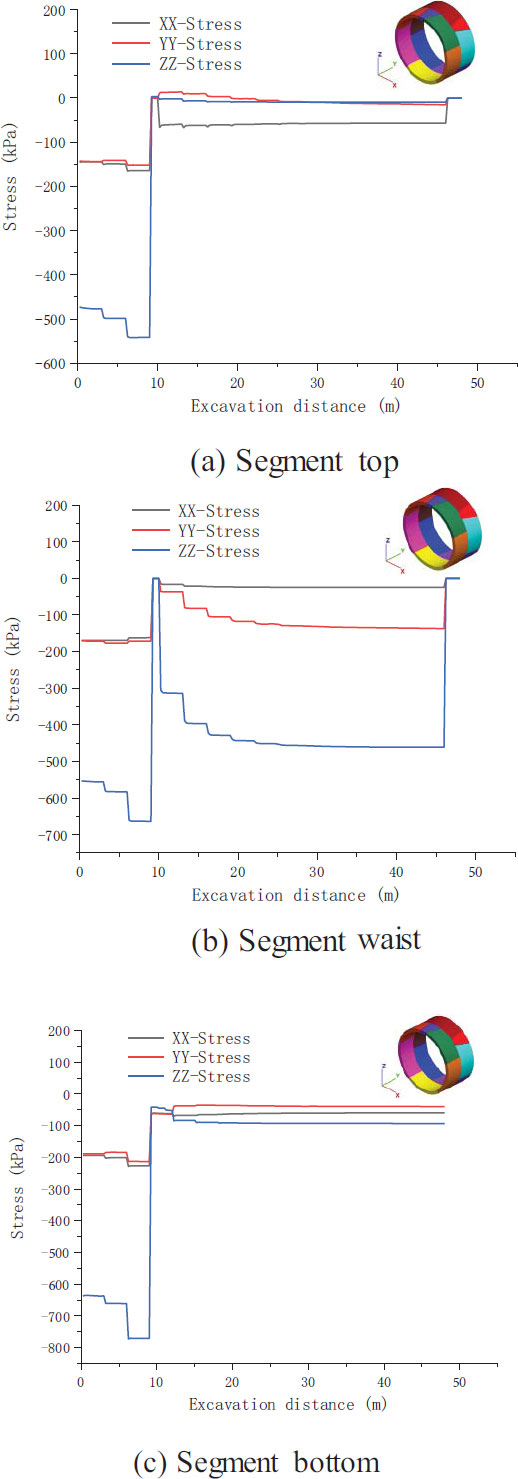
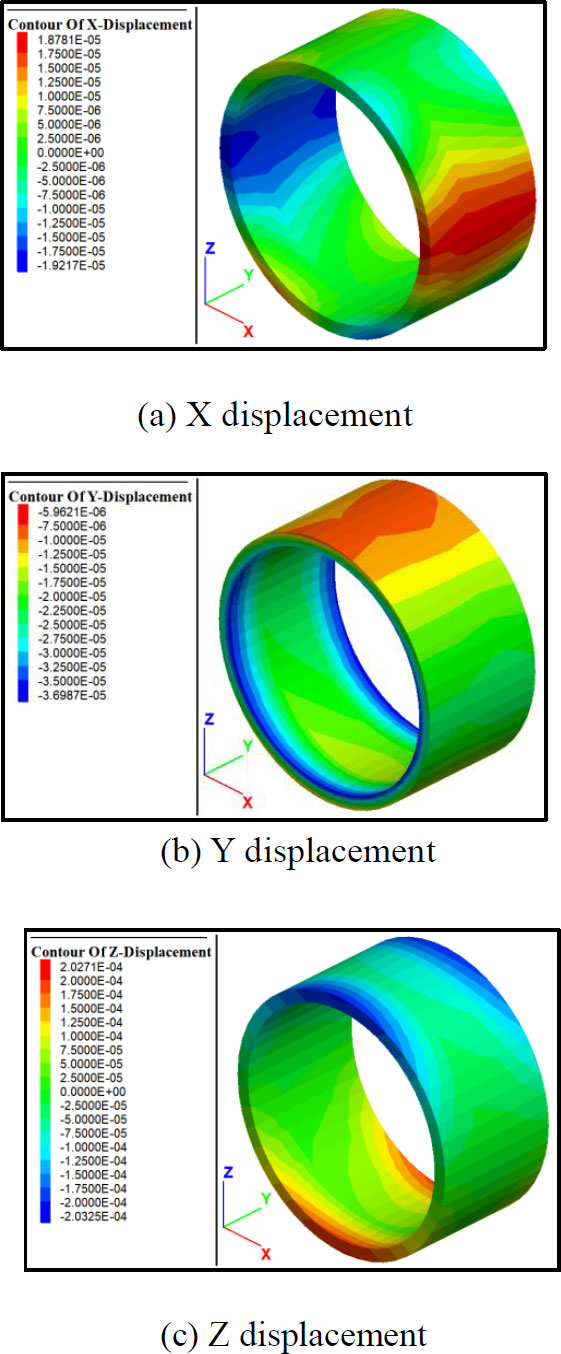
Fig. (4) illustrates the displacement nephograms of the fourth group of segments after the completion of tunnel excavation. In Fig. (4a), the displacement of the segments in the x-direction reaches the maximum value of 0.0197 mm at the two sides of the arch waist. Fig. (4b) indicates that the displacement in the y-direction is negative (in the direction of tunnel excavation). The maximum stress reaches 0.0375 mm at the edge of the segment ring. As displayed in Fig. (4c), the displacements of the vault and arch bottom are the largest in the z-direction, and the maximum displacement reaches 0.2 mm. The vertical displacement is the largest in all parts of the segment.
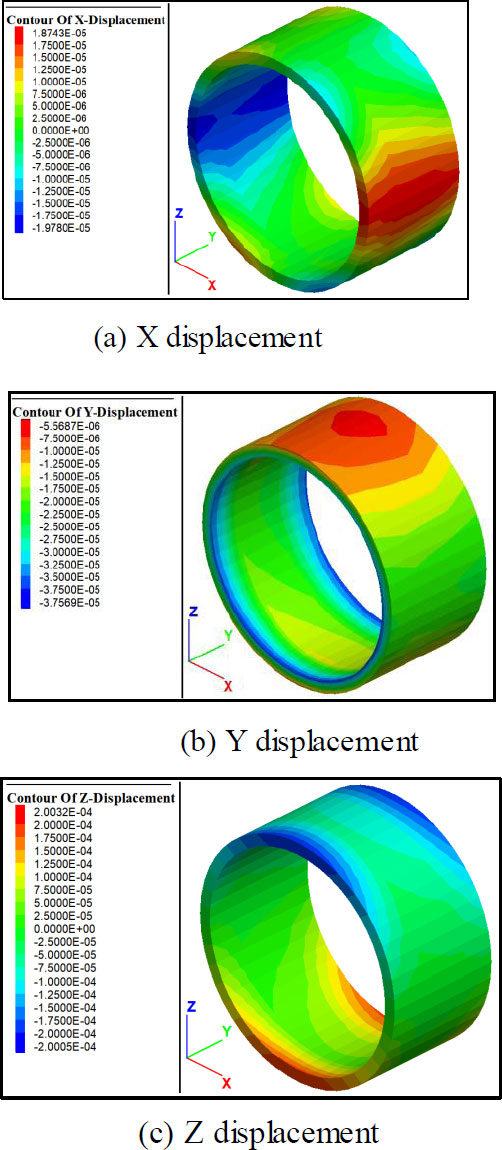
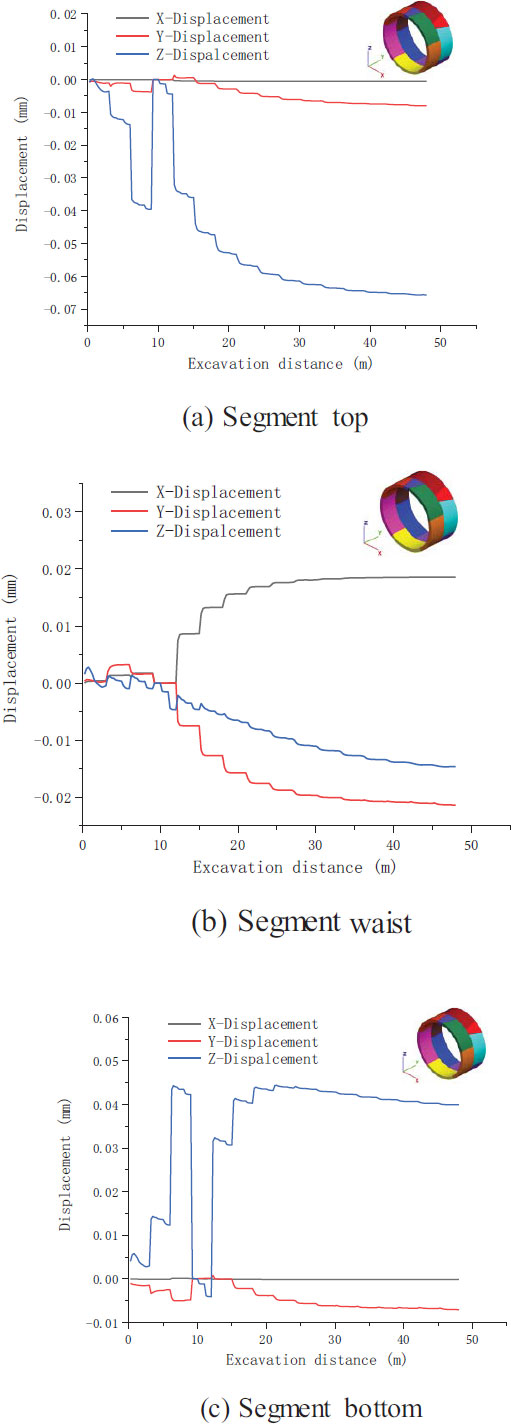
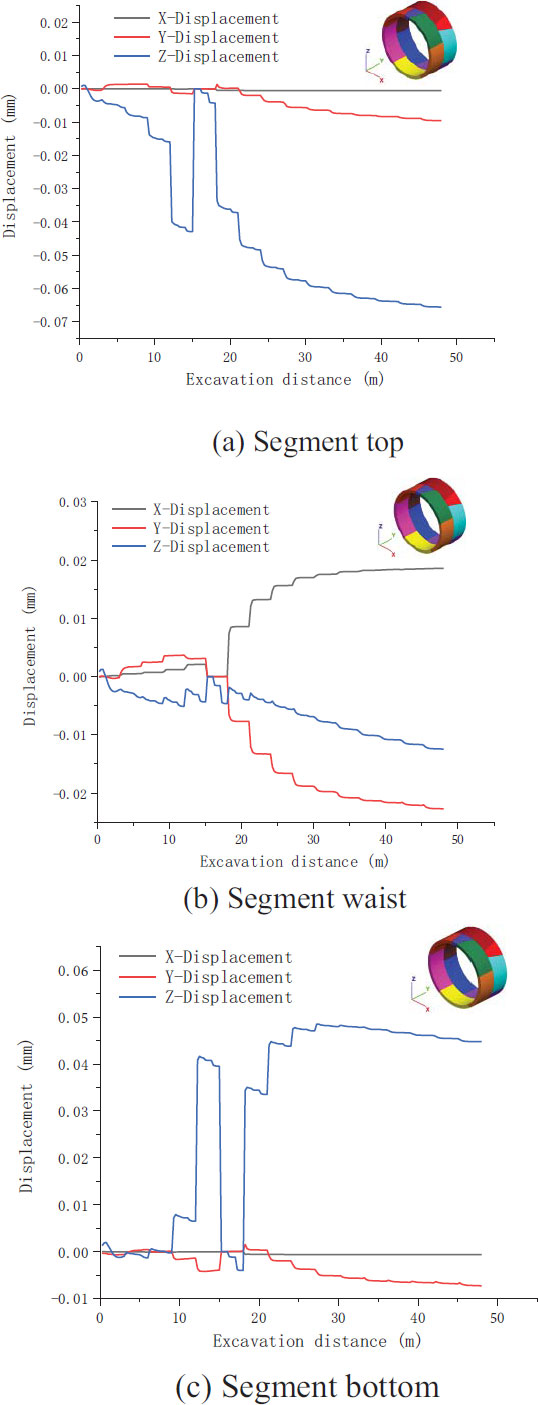
Fig. (5) shows the displacement curves of the segment vault, arch waist, and outside of the arch bottom during tunnel excavation. The data collected after 9 m of tunnel excavation are segment displacement data. In Fig. (5a), the displacement in the z-direction is the largest in the vault. After laying the segments, the displacement increases rapidly, reaching 0.035 mm when the excavation reaches 12 m and increasing to more than 0.06 mm with continued excavation. The displacements in the x- and y-directions are relatively similar. Fig. (5b) indicates that the displacements in the arch waist are relatively similar in the three directions and increase with excavation. As illustrated in Fig. (5c), the z-direction displacement of the arch bottom is the largest and increases rapidly with excavation, reaching a maximum value of 0.45 mm. There are little differences between the x- and y-direction displacements, which decrease with increasing excavation.
Structural stress and deformation of Group 4 shield segments. Under this working condition, the shield tunnelling machine needs to adapt to different formation characteristics to avoid excessive settlement differences in the composite rock formation. One possible strategy is to adopt a compound TBM, that is, to add a front cutting cutter to the single shield TBM, which can be switched according to different formations to achieve adaptive drilling of soft and hard rock formations. In addition, it is necessary to optimise the TBM driving parameters, such as the thrust, torque, and cutter speed, to ensure driving efficiency and quality.
3.3. Case 2: Structural Stress and Deformation of Group 6 Pipe Piece
A group of segments 0–3 m below the building structure was excavated (7th and 8th ring segment structures). When the tunnel was excavated to the front of Group 6, the segment structure of Group 6 was not stressed. In Group 6, the structure worked after excavation to the sixth loading step.
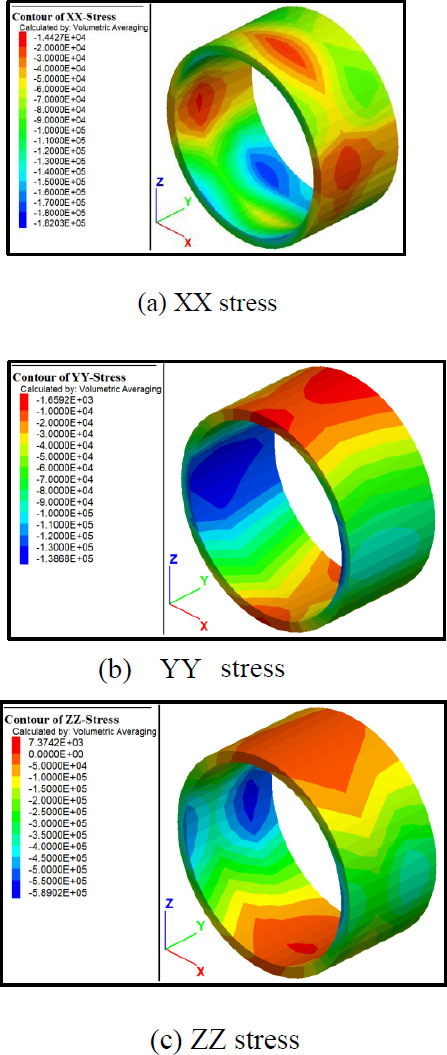
Fig. (6) depicts the stress nephograms of the sixth group of segments after the completion of tunnel excavation. In Fig. (6a), the stress of the segments in the x-direction is negative, reaching a maximum value of 0.182 MPa at 45° inclination on the left and right sides of the arch bottom. Fig. (6b) indicates that the stress in the y-direction is also negative, and the maximum stress reaches 0.138 MPa at the arch waist on both sides. The stress in the z-direction is negative, and the maximum stress reaches 0.589 MPa in the arch waist on both sides of the segment (Fig. 6c).
Fig. (7) illustrates the stress curves of the vault, arch waist, and arch bottom outside the segment during tunnel excavation. The data collected after 15 m of tunnel excavation are the stress data outside the segment. Fig. (7a) shows that the absolute value of the stress in the x-direction is the largest, and the stress immediately after the segment is laid reaches 19 kPa. The stresses in the y- and z-directions are similar. In Fig. (7b), the arch waist stress changes little with excavation and is maintained within 5–30 kPa. The stresses in the x-, y-, and z-directions of the arch bottom are almost the same and are maintained within 0–10 kPa (Fig. 7c).
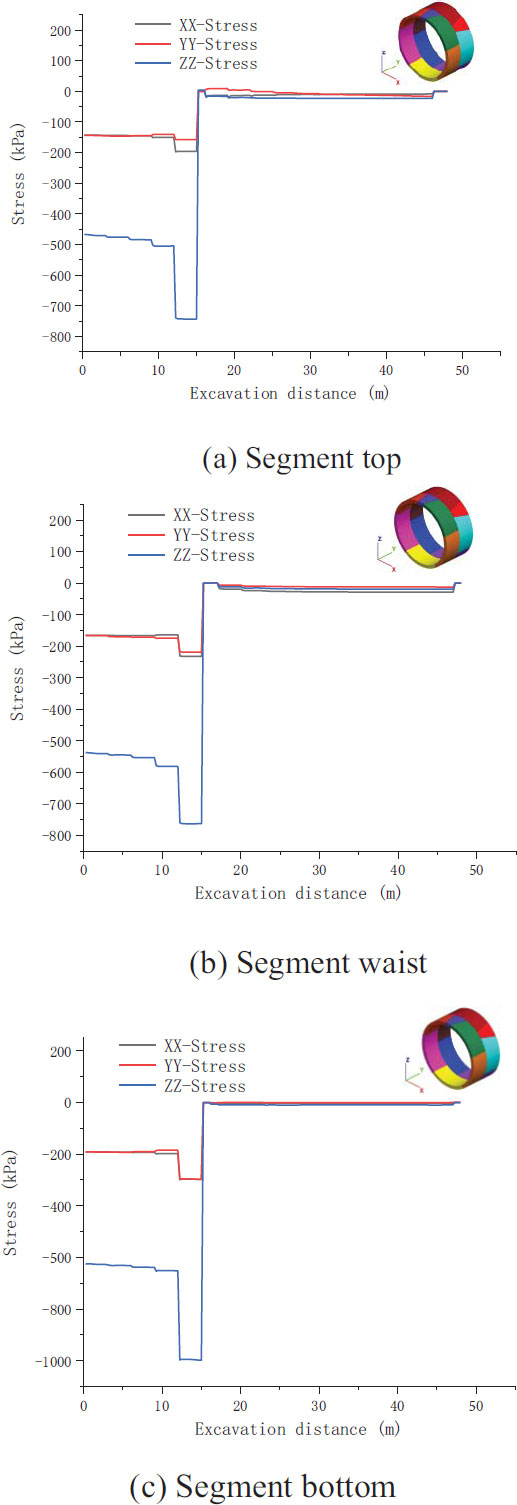
Fig. (8) displays the displacement nephograms of the sixth segment after the completion of tunnel excavation. In Fig. (8a), the displacement of the segment in the x-direction reaches the maximum value of 0.0192 mm at the arch waist of both sides. Fig. (8b) indicates that the displacement in the y-direction is negative (in the direction of tunnel excavation). The maximum stress reaches 0.0369 mm at the edge of the segment ring. In Fig. (8c), the displacements of the vault and arch bottom are the largest in the z-direction, reaching 0.2 mm. The vertical displacement is the largest in all parts of the segment.
Fig. (9) depicts the displacement curves of the segment vault, arch waist, and outside of the arch bottom during tunnel excavation. The data collected after 15 m of tunnel excavation are the displacement data of the segment. In Fig. (9a), the displacement in the z-direction is the largest in the vault. After laying the segments, the displacement increases rapidly, reaching 0.035 mm when the excavation reaches 18 m and increasing to more than 0.06 mm as the excavation continues. The displacements in the x- and y-directions are relatively similar. Fig. (9b) indicates that the displacements for the arch waist in the three directions are relatively similar. The displacements in the x- and y-directions reach 0.02 mm, whereas the displacement in the z-direction reaches 0.13 mm. The displacement at the arch waist increases with excavation. As displayed in Fig. (9c), the z-direction displacement of the arch bottom is the largest and increases rapidly with excavation, reaching 0.47 mm. There are little differences between the x- and y-direction displacements, which decrease with increasing excavation.
Structural stress and deformation of Group 6 shield segments. Under this condition, when the shield tunnelling machine penetrates the existing building, it is necessary to strictly control the settlement of the surface and building to avoid damage to the existing structure. One possible strategy is to use synchronous grouting (secondary grouting) technology to inject cement slurry or other filling materials between the shield tail and segments to compensate for the gaps caused by soil loss and reduce surface settlement. In addition, it is necessary to perform monitoring measurements and early warning judgment, use the field monitoring grouting data to dynamically adjust the tunnelling parameters and grouting amount of the shield machine, and timely detect and deal with abnormal situations.
3.4. Case 3: Structural Stress and Deformation of Group 8 Pipe Piece
A group of segments directly below the building structure was excavated (15th and 16th ring segments). When the tunnel was excavated to the front of Group 8, the segment structure of Group 8 was not stressed. In Group 8, the structure worked after excavation to the eighth loading step.
Fig. (10) shows the stress nephograms of the eighth segment after the completion of tunnel excavation. As indicated in Fig. (10a), the stress of the segment in the x-direction is negative, and the maximum stress reaches 0.221 MPa at 45° inclination on the left and right sides of the arch bottom. The stress in the y-direction is also negative, and the maximum stress reaches 0.137 MPa at the arch waist on both sides (Fig. 10b). The stress in the z-direction is negative, reaching a maximum value of 0.64 MPa, and the position is concentrated in the arch waist on both sides of the segment (Fig. 10c).
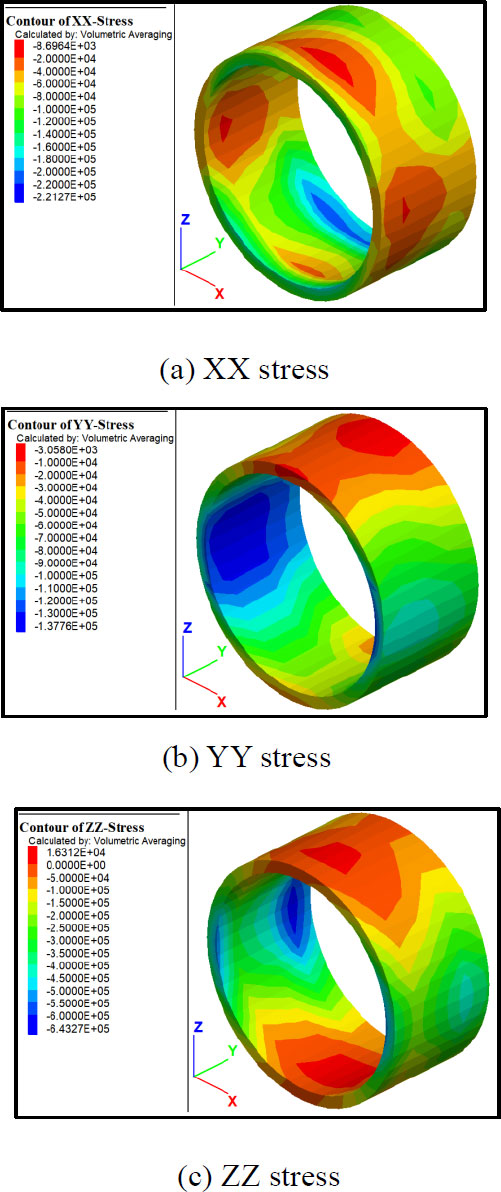
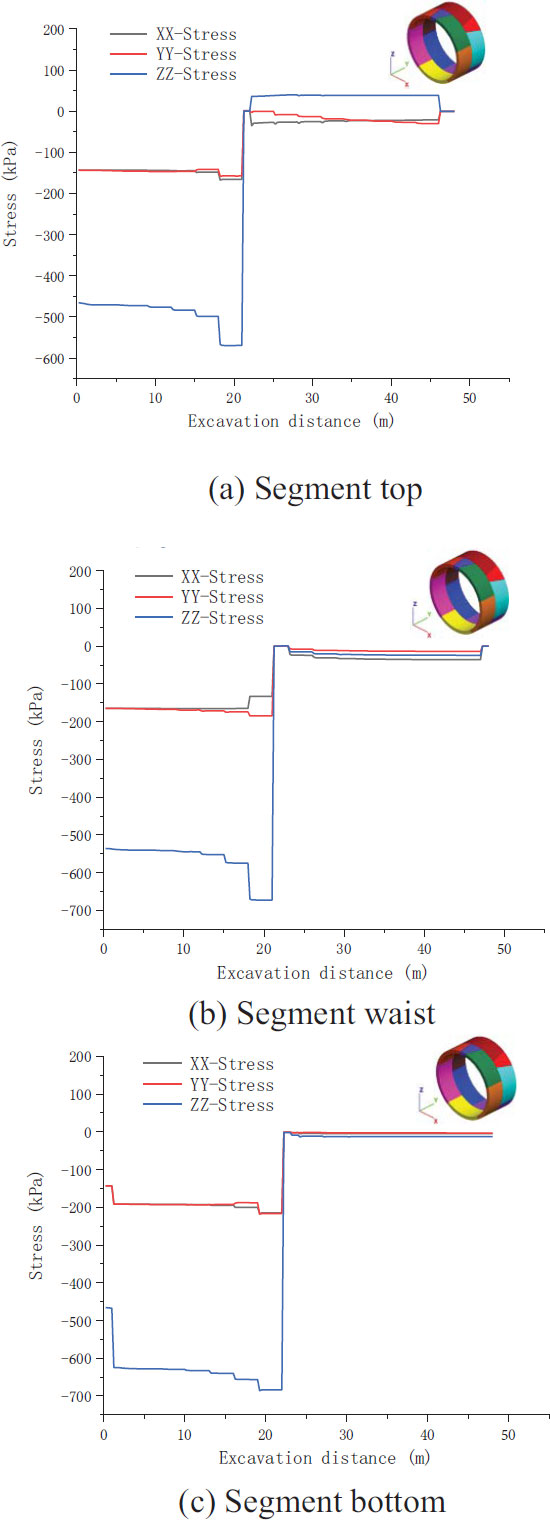
Fig. (11) displays the stress curves of the vault, arch waist, and arch bottom outside the segment during tunnel excavation. The data collected after 21 m of tunnel excavation are the stress data outside the segment. As shown in Fig. (11a), the absolute value of the stress in the z-direction is the largest, the stress value immediately after the segment is laid reaches 40 kPa, and the stress difference in the x- and y-directions is small (approximately 25 kPa). The arch waist stress changes little with excavation and is maintained within 5–30 kPa (Fig. 11b). The stresses in the x-, y-, and z-directions of the arch bottom are almost the same and are maintained within 0–12 kPa (Fig. 11c).
Fig. (12) depicts the displacement nephograms of the eighth segment after the completion of tunnel excavation. As indicated in Fig. (12a), the displacement of the segment in the x-direction reaches the maximum at the arch waist on both sides, and the maximum value reaches 0.0208 mm. In Fig. (12b), the displacement in the y-direction is negative (in the direction of tunnel excavation), and the maximum stress reaches 0.0389 mm at the edge of the segment ring. Fig. (12c) shows that the displacements of the vault and arch bottom in the z-direction are the largest, reaching a maximum of 0.2 mm. The vertical displacement is the largest in all parts of the segment.
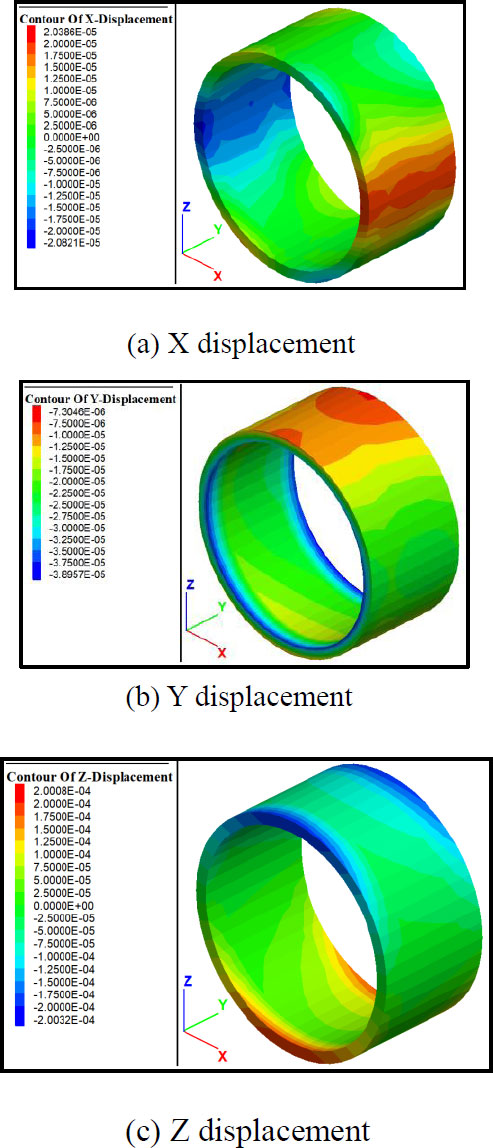
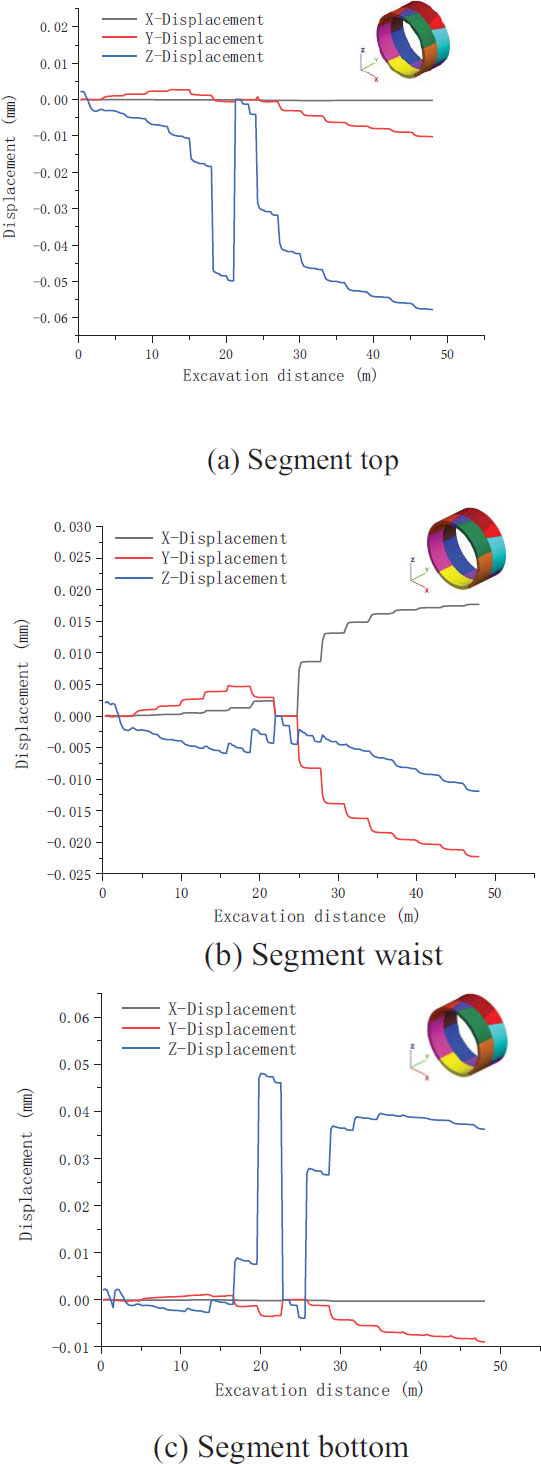
Fig. (13) illustrates the displacement curves of the segment vault, arch waist, and outside of the arch bottom during tunnel excavation. The data collected after 21 m of tunnel excavation are the segment displacement data. In Fig. (13a), the displacement in the z-direction is the largest in the arch crown. After laying the segments, the displacement increases rapidly, reaching 0.032 mm when the excavation reaches 24 m and increasing to approximately 0.06 mm with continuing excavation. Fig. (13b) indicates that the displacements of the arch waist in the three directions are relatively similar: the displacements in the x- and y-directions reach 0.02 mm, and those in the z-direction reach 0.12 mm. The displacement at the arch waist increases with excavation. In Fig. (13c), the z-direction displacement of the arch bottom is the largest. It increases rapidly with continuing excavation and attains a maximum value of 0.41 mm. The displacement in the x-direction is almost unchanged, whereas that in the y-direction increases to 0.01 mm.
Structural stress and deformation of Group 8 shield segments. Under this condition, the sealing and stability between the segments should be ensured to avoid leakage and deformation after the shield tunnelling machine finishes the composite rock formation. A possible technique is to use a segment material with high strength, toughness, and wear resistance and adopt a reasonable assembly method and joint design. In addition, post-inspection and maintenance are required to regularly check the structural integrity and sealing performance of the segments and to repair or replace the damaged segments in a timely manner.
4. ANALYSIS OF SURFACE SETTLEMENT CHARAC- TERISTICS IN UNDERPASS CONSTRUCTION CONDITIONS
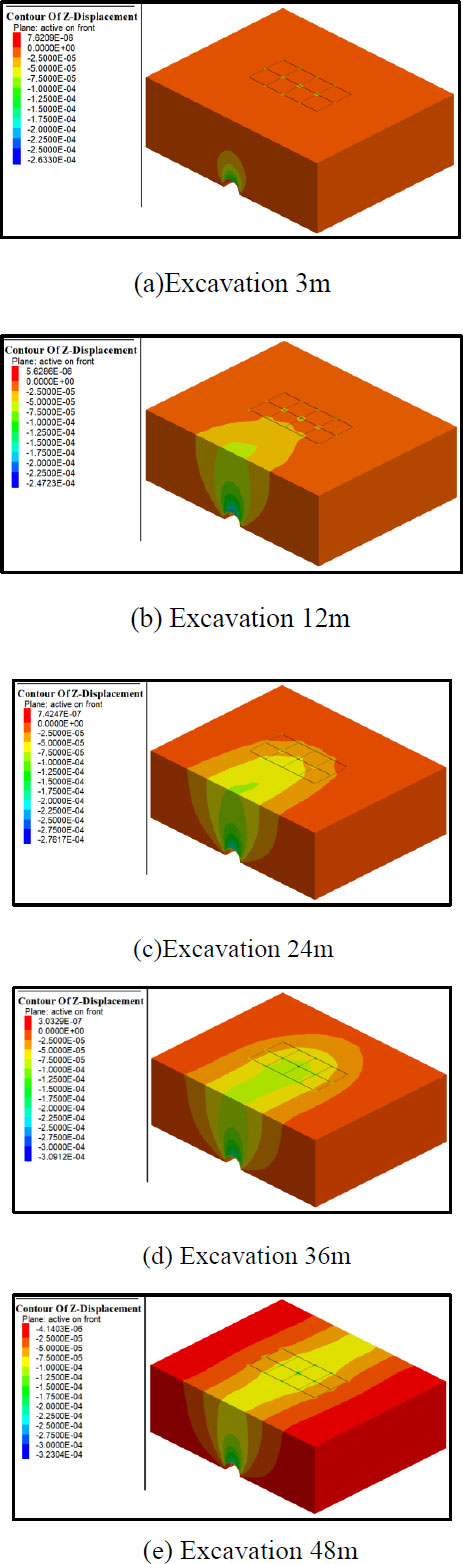
Soil displacement is a main cause of damage to surface buildings. Changes in the surface subsidence with continuing TBM excavation were analysed. The tunnel was excavated gradually from y = 0 m. Fig. (14) shows the surface settlement at distances of 3, 12, 24, 36, and 48 m. It was observed that the TBM excavation caused the ground in front of the excavation surface to rise and the ground behind the excavation surface to sink. With continuing excavation, settlement grooves were gradually formed. After the excavation reached 3 m, it had a significant influence on the settlement, only within 1.5 times the diameter of the tunnel. The maximum settlement of the tunnel top was 0.26 mm, with a weak effect on the bottom of the building. After excavation reached 12 m, the area affected by the settlement reached the side of the building, posing the risk of uneven building settlement and building inclination. When the excavation reached 24 m, the settlement covered almost the entire building area. After 36 m of excavation, the area affected by the settlement completely surrounded the building. At this time, the influenced area was distributed in a U-shaped contour. A greater settlement effect on the inner side attachment produced a smaller effect on the outer side, and driving the TBM vertically allowed the building settlement to be reduced [11].
CONCLUSION
The effects of surface settlement caused by TBM construction are complex and difficult to accurately calculate and predict. Thus, real-time monitoring and control must be implemented during TBM construction to obtain land subsidence information at all times, allowing sufficient time to take effective measures to control subsidence and reduce losses. Through simulation analysis of TBM tunnelling undercrossing a building, we found the following:
Firstly, the stress and deformation of the segments varied at different positions, and the segments in front of the building were significantly affected by the building; secondly, the vertical displacements of the vault and arch bottom were the largest, and the influences of vertical accessories were stronger for segments closer to the building; and lastly, the building was affected when the tunnel was excavated to approximately the diameter of the tunnel in front of it, and the surrounding rock stability was a key factor for the safety of the building and the tunnel.
CONSENT FOR PUBLICATION
Not applicable.
AVAILABILITY OF DATA AND MATERIALS
The data that support the findings of this study are available from the corresponding author, [W.K], on special request.
FUNDING
This study was funded by National Natural Science Foundation of China (Funder ID: 52179106).
CONFLICT OF INTEREST
The authors declare no conflict of interest, financial or otherwise.
ACKNOWLEDGEMENTS
Declared none.

