All published articles of this journal are available on ScienceDirect.
Suitability of Using LA Abrasion Machine for the Nano Manufacturing of Palm Oil Fuel Ash and Incorporating in Mortar Mixture
Abstract
Background
In order to enhance the properties of palm oil fuel ash-based mortar, researchers have explored the concept of reducing palm oil fuel ash (POFA) to a nanoscale. While previous studies have utilized ball milling machines with high grinding speed to achieve nano-scale POFA, the Los Angeles abrasion machine, which is more readily available and has a slower grinding speed, has been rarely employed.
Objective
The study aimed to investigate the suitability of using a Los Angeles abrasion machine with a low grinding speed to produce nano palm oil fuel ash. This paper also provides a comparison of the effect of using the nano POFA with different particle sizes within the range of 982 to 150 nm on the mortar’s flowability and compressive strength.
Methods
To produce nano-size palm oil fuel ash using the Los Angeles abrasion machine, the received palm oil fuel ash was thermally treated and ground using a Los Angeles abrasion machine with varying grinding periods. The grinding process parameters were kept constant, but second grinding periods of 50,000, 80,000, and 110,000 cycles were introduced. All three types of nano palm oil fuel ash were analyzed for their physical properties, chemical properties, morphology, and mineralogy. Furthermore, these nano palm oil fuel ashes were incorporated into a designed mortar mix along with micro palm oil fuel ash. The mortar’s fresh properties and compressive strength at different curing ages were observed and analyzed. The relationship between various factors, such as the replacement rate of micro, nano palm oil fuel ash, the grinding cycles of nano POFA, and the corresponding responses, specifically the compressive strength at different curing ages, was analyzed and explained using the response surface methodology.
Results
The 110k cycle nano palm oil fuel ash had a smaller particle size of 103.1 nm, while a particle size of 529 nm and 325 nm was found in the 50k and 80k cycle nano palm oil fuel ash. In terms of the combination of micro and nano palm oil fuel ash in the mortar, increasing the dosage of nano palm oil fuel ash contributed to improvements in flow diameter and compressive strength. However, the opposite trend was observed with micro palm oil fuel ash. The optimal mix design for the combination involved using 10% micro and 2 to 3% nano palm oil fuel ash. This composition led to an improvement rate of 7.9%, 1.48%, and 4.6% in compressive strength at 7, 28, and 90 days, respectively. While, the response surface methodology’s numerical optimization also supported the use of a similar combination. However, it additionally recommended employing the 50,000-cycle nano palm oil fuel ash in the mortar for earlier curing stages, while the 110,000-cycle nano palm oil fuel ash was suggested for later curing stages.
Conclusion
Los Angeles abrasion machine could be utilized to produce nano palm oil fuel ash with a particle size up to 103 nm with the aid of designed parameters. In this mortar mix design, the impact of a small variance in nano palm oil fuel ash’s particle size was trivial compared to the replacement rate of micro palm oil fuel ash on the mortar’s compressive strength.
1. INTRODUCTION
To achieve the 1.5 to 2°C stabilization in global temperature rise that has been agreed upon by the international community during the COP21 event in Paris, the approach of reducing CO2 emission to net zero was implemented worldwide, especially in the CO2-intensive sectors [1, 2]. The cement industry plays one of the important roles responsible for global CO2 emissions up to 8% annually generated from the decomposition of limestone and fossil fuel combustion during cement production [3, 4]. Thus, several efforts to reduce carbon emissions in the cement industry have been made, including utilizing supplementary cementitious materials (SCMs) in the concrete mix as cement replacement [5, 6]. The SCMs that are either an industry by-product or natural materials have pozzolanic properties and, thus, the use of SCM for cement substitution in the concrete mix has led to improvements in concrete’s late hardened properties, durability, and a reduction in heat of hydration [7-9].
Palm oil fuel ash (POFA) has a high content of silica, which is responsible for the pozzolanic reaction, and can be used as a cement replacement. It is a byproduct that is generated from the combustion of palm oil waste during palm oil extraction with an expected annual production rate of up to 10 to 12 million tons [10-12]. Turning it into cement replacement seems to be a better choice rather than disposing and it becoming a potential environmental pollutant. The POFA has been reported to contain high unburned carbon content and non-uniform physiochemical properties, which result in affecting the fresh properties and engineering properties of the concrete incorporating raw POFA beyond the optimum replacement rate [13-15]. Hence, the effort to reduce the fineness of SCM particles has been made to improve the SCM’s pozzolanic reactivity, which has been found to later enhance both the fresh and engineering properties of concrete [16, 17]. Nano-scale POFA has been extensively utilized as a cement replacement to enhance POFA cement mixtures, and reported positive results. In terms of fresh properties, the nano POFA-based concrete exhibited greater workability than the control sample. Hassan et al. [18] and Tang [19] reported that the utilization of nano POFA with the particle size range of 20 to 90 nm improved the slump value of concrete up to 7% than the control at the dosage of 3%. This can be attributed to the low unburned content of nano POFA and its better lubrication effect [19-21]. In terms of hardened properties, the nano POFA-based cement mixtures showed significant improvements ranging from 2% to 35% across all curing ages, surpassing the performance of micro and raw POFA at a higher optimum replacement rate [22-24].
The production of nano-structured POFA is predominantly achieved through the use of a high-energy ball milling machine, with the reported particle size ranging from 20 nm to 150 nm [20, 22, 25, 26]. Unfortunately, less detail regarding the nano-structuring process of the nano POFA has been provided in the abovementioned papers. Hassan et al. [18] used the high energy ball milling machine with a capacity of 0.032 m2 and a combination of various diameters of steel balls to grind the POFA from micro to nanoscale in 5 hours. In contrast, Rajak et al. [27], who used the ceramic ball milling machine to produce the nano POFA in the size of 20 to 90 nm, reported a grinding time of 30 hours. Rizal et al. [28] further explored the optimum grinding conditions to produce nano POFA more efficiently by using a high-energy ball milling machine, and concluded that the optimum parameters were using the iron ball size of 20 mm diameter, grinding time of 24 hours, and milling speed of 100 rpm. Compared to those authors who used the high-energy ball milling machine with a faster grinding speed, only Hamada et al. [29] produced the nano POFA with a particle size of 982 nm by using the Los Angeles (LA) abrasion machine, which had a lower grinding speed.
It can be concluded that factors, such as the weight ratio of steel ball to input POFA, ball diameters, grinding time, and grinding speed, impact the efficiency of producing nano POFA. Designing a grinding parameter with a longer grinding time, fixed weight ratio of steel balls to feed POFA, a combination of various diameter steel balls, and lower grinding speed might improve the grinding efficiency. Most of the past researchers have utilized high-energy ball milling, which grinds the POFA at a higher grinding speed, but Rizal et al. [28] recommended that using a lower grinding speed might give better grinding efficiency. The author warned that the high temperature produced during the machine operation might deform the particle properties as well as increase the average crystal size of the feed material. Moreover, the conventional ball milling machine with a bigger capacity usually has a slower grinding speed. However, the usage of a ball grinding machine with a lower grinding speed, such as an LA abrasion machine, in producing nano POFA is limited, and the produced POFA’s particle size is not in the range of nanoscale. Hence, improving the grinding parameters of low-speed grinding machines to produce nano-scale POFA is worth trying. Apart from that, the nano POFA with particle size ranging from 150 nm to 985 nm has rarely been discovered in past studies, especially the particle properties and impact on cementitious mixture’s properties.
Mathematical and statistical analyses, such as response surface methodology (RSM), are frequently employed in the investigation of cement mix design for experimental design optimization [30-32]. This optimization process is crucial for selecting an appropriate mix design that fulfills specific concrete requirements. Compared to conventional optimization methods, such as trial and error or single-variable methods, RSM offers a more efficient approach that saves time and resources [33]. Unlike conventional methods, the RSM offers appropriate solutions considering the relationship between various factors and responses. This makes it an ideal tool for determining the optimum response and optimum condition from multiple responses [34].
Thus, this work has further explored the suitability of utilizing the Los Angeles abrasion machine that has a lower grinding speed of 33 rpm for producing the nanoscale POFA. After that, this work has investigated the physiochemical properties of the nano POFA with the expected particle size in the range of 982 nm to 150 nm as well as the substitution effect of the nano POFA on the mortar’s properties. The grinding parameters have been modified based on the work of Hamada et al. [35] and the recommendation from Rizal et al. [28], incorporating a different iron ball size, a fixed weight ratio of iron ball to feed, and testing of different grinding cycles. Following the grinding process, the nanoscale POFA samples produced with varying grinding cycles underwent physical, chemical, and morphological property tests. Subsequently, both the nanoscale POFA and micro POFA were incorporated as cement replacements in mortar mix designs. The fresh properties and hardened properties of the resulting mortars were evaluated at different curing ages. Lastly, the RSM was implemented during data analysis to determine the impact of various factors, including the different grinding cycles of nano POFA, on the hardened properties of mortar.
2. MATERIALS AND METHODS
2.1. Micro and Nano Scale POFA Preparation
2.1.1. Micro POFA
The raw POFA was collected from the palm oil mill located at Gambang, Pahang, Malaysia, and kept in the Concrete Lab University Malaysia Pahang. POFA was dried in an oven with a temperature of 100 ± 5 °C for one day to remove the excess water moisture in the ash before being further processed. Next, the dried raw POFA was sieved through the 300 μm sieve to remove the excess unburnt carbon. To further reduce the sieved POFA’s particle size to less than 45 μm, the dried sieved POFA was ground in the LA abrasion machine with a grinding speed of 33 rpm for 10,500 cycles with a dosage of 3 kg per round. To ensure that the particle size of the ground POFA was less than 45 μm, around 100 g of ground POFA was obtained after each round of grinding and sieved through the 45 μm sieve. Each batch of ground POFA was kept only if the passing rate of the ground POFA was more than 90% passing through the 45 μm sieve according to the standard, ASTM C618-2019. The ground POFA was burnt in the furnace at the temperature of 600°C for 2 hours to fully remove the unburned carbon in it. Until this stage, this POFA was marked as micro POFA.
2.1.2. Nano POFA
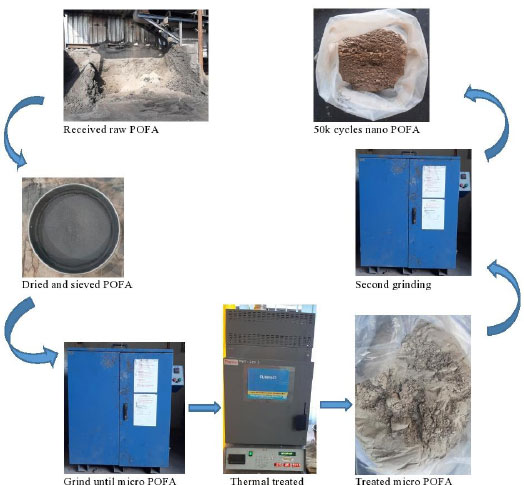
To prepare nanoscale POFA, the micro POFA was ground in the same LA machine again, but with different grinding parameters. A constant weight ratio of iron steel ball to feed was maintained at 10:1, while there were two types of iron ball diameter used, which were 50 mm and 20 mm. The mass of the feed POFA was 1.5 kg, while the total weight of the steel was 15kg. Finally, the grinding time was designed as 50,000, 80,000, and 110,000 cycles. The grinding cycles, 50,000, 80,000, and 110,000 are denoted as 50k, 80k, and 110k in this paper. The preparation process for 50k cycles of nano POFA is presented in Fig. (1).
2.2. POFA Characteristics
2.2.1. Physical Properties
The physical properties of POFA were evaluated in terms of the specific surface area and particle size. The specific surface area of POFA was determined with the Brunauer–Emmett–Teller (BET) analysis. The preliminary checking of the particle size of POFA was carried out by using a dry sieve to fulfill the particle size requirement of the ASTM C618-2019 standard. Later, the actual particle size as well as the particle size distribution of POFA were tested by the particle size analyzer.
2.2.2. Loss of Ignition (LOI)
ASTM D7348-21 standard was referenced to measure the LOI value of all types of POFA. Around 1 ± 0.5 g of POFA was weighed and placed in the oven-dried crucible. Then, the POFA with the crucible was dried in the oven for an hour, and the weight of the dried POFA and crucible was recorded. Next, the POFA was placed in a desiccator to let it cool. The next step was heating the samples in a furnace for 2 hours at a temperature of 950 ºC. The fired sample was then cooled to room temperature in a desiccator, and the weight was recorded. The weight loss at this stage was taken as the LOI value.
2.2.3. Chemical Properties, Mineralogy, and Morphology of POFA
The chemical properties of POFA were examined through X-ray fluorescence (XRF). X-ray diffraction (XRD) was carried out on the POFA to test the mineralogy of POFA. The start and end angle of the XRD analysis was 2 degrees and 90 degrees, respectively, while the step size was 0.05 degrees per minute. The morphology of the POFA was determined through scanning electron microscopy (SEM).
2.3. POFA as Cement Replacement in Mortar Mix
2.3.1. Cement
The type 1 Ordinary Portland Cement (OPC) that was obtained from a local supplier was used in this experiment. The specification of the OPC followed the standard. The cement was produced by a local cement manufacturer by following the MS EN197-2014 CEM I 52.5 N.
2.3.2. Aggregate
The river sand was used as fine aggregate with a size between 1.18 mm to 0.6 mm by following the ASTM C778-2021 standard.
2.3.3. Water
Portable tap water was used in the cement paste and mortar mix design where the water was supplied by Jabatan Bekalan Air Pahang. The used water in the mix design was required to be clean and unpolluted to avoid disturbing the cement hydration process and curing process.
2.3.4. Mortar Mix Design
The preparation and mixing of mortar were carried out in accordance with the ASTM C109-2021 standards. The mortar was designed to have a cement-to-sand ratio of 1:2.75, while the cement-to-water ratio was 1:0.485. The mold size for the compressive test was 50 mm x 50 mm x 50 mm (L x W x H). The replacement rate of the micro POFA and nano POFA is presented in Table 1. The mortar was removed from the mold after one-day casting and subjected to water curing until 7-, 28- and 90-day curing ages.
2.4. Fresh and Hardened Properties of Mortar
2.4.1. Fresh Properties
The flowability of the mortar has been studied to explore the impact of introducing the combination of nano and micro POFA on the mortar mix design. The flow of fresh control mortar was controlled at 110 ± 5 of the flow table by referring to the ASTM C109-2021 standard.
| Mix No. | Micro POFA Replacement Rate (%) | 50k Cycles Nano POFA Replacement Rate (%) | 80k Cycles Nano POFA Replacement Rate (%) | 110k Cycles Nano POFA Replacement Rate (%) |
|---|---|---|---|---|
| M0 | 0 | 0 | 0 | 0 |
| M10N1 | 10 | 1 | 1 | 1 |
| M10N2 | 10 | 2 | 2 | 2 |
| M10N3 | 10 | 3 | 3 | 3 |
| M20N1 | 20 | 1 | 1 | 1 |
| M20N2 | 20 | 2 | 2 | 2 |
| M20N3 | 20 | 3 | 3 | 3 |
| M30N1 | 30 | 1 | 1 | 1 |
| M30N2 | 30 | 2 | 2 | 2 |
| M30N3 | 30 | 3 | 3 | 3 |
2.4.2. Hardened Properties
A compressive strength test of mortars from each POFA specimen was conducted in triplicate at the 7, 28, and 90-day curing age in accordance with ASTM C109-2021 by using the universal testing machine. Later, the interaction between the mortar mix design, grinding cycles of nano POFA, and the hardened properties of mortar at different curing ages has been expressed with the aid of statistical test setup and response surface methodology (RSM).
3. RESULTS AND DISCUSSION
3.1. Properties of POFA
3.1.1. Physical Properties
The physical properties of three types of nano POFA are presented in Table 2. It can be observed that the 50k cycle nano POFA had a particle size of 529.0 nm; while increasing the grinding cycle to 110k, the particle size of nano POFA decreased to 103.1 nm. This demonstrates the potential of using the Los Angeles abrasion machine to produce nano POFA by manipulating the grinding parameters. In terms of specific surface area, the 110k cycle nano POFA demonstrated the highest value, indicating a larger surface area per unit mass. On the other hand, the 50k cycle nano POFA had a lower specific surface area, aligning with the observed particle size trend. All types of nano POFA had a greater specific surface area than the reported nano POFA, only having a value of 1.962 m2/g for the 982 nm POFA and 3 m2/g for the 100 to 150 nm nano POFA [36, 37].
3.1.2. Loss of Ignition (LOI)
The POFA’s LOI percentage reflects its unburnt carbon content, which later impacts the properties of cement mixture containing POFA as cement replacement [38, 39]. Chen et al. [40] and Phethany [41] found that the cement mixture having the lower LOI percentage of SCM exhibited a lower demand for the superplasticizer, shorter setting time at a constant substitution rate, and slightly impact its hardened properties. Table 3 presents the LOI value of various types of POFA. The raw POFA that was obtained from the palm oil mill had a high carbon content, where the LOI value reached 28.13%, which was far exceeding the limit stated in ASTM C618. After being sieved, ground, and thermally treated in the electric furnace at the temperature of 600°C for 2 hours, the LOI value of the micro POFA successfully reduced to 2.54%, which was lower than the limit set in the standard, and the reduction of POFA’s LOI value aligned with other studies that have carried out thermal treatment [20, 38, 42]. However, the second grinding of micro POFA in the LA abrasion machine for the nano-structuring process led to the increment in the LOI value of all nano-scale POFA, but the LOI value of all nano POFA was still below 6%.
| Properties | 50,000 Cycles Nano POFA | 80k Cycles Nano POFA | 110k Cycles Nano POFA |
|---|---|---|---|
| Diameter, D50 (nm) | 529.0 | 325.0 | 103.1 |
| Specific surface area (m2/g) | 5.81 | 5.92 | 5.99 |
| Type of POFA | LOI Value (%) |
|---|---|
| Raw POFA | 28.13 |
| Sieved POFA | 10.85 |
| Ground POFA | 14.07 |
| Micro POFA | 2.54 |
| 50k cycle nano POFA | 5.03 |
| 80k cycle nano POFA | 4.34 |
| 110k cycle nano POFA | 5.61 |
3.1.3. Chemical Properties of POFA
The content of chemical components, especially the minimum content of the sum of Al2O3, SiO2, and Fe2O3 is stated in the standard ASTM C618. It can be found that the raw POFA not only had a high content of carbon, which was represented by the LOI value, but its silica content has also been found to be very low, i.e., only 13.7%, as reported in Table 4. After being thermally treated and with reducing particle size, as the carbon has been removed from the ash, the content of Al2O3, SiO2, and Fe2O3 in micro POFA and 80k cycle nano POFA was found to increase significantly, and the sum of those three components was reported at 70.96% and 75.38%, respectively, which exceeded the minimum requirement listed in the standard. A similar improvement has been reported earlier [22, 38] using the thermal treatment and grinding methods to enhance the content of Al2O3, SiO2, and Fe2O3.
3.1.4. Mineralogy of POFA
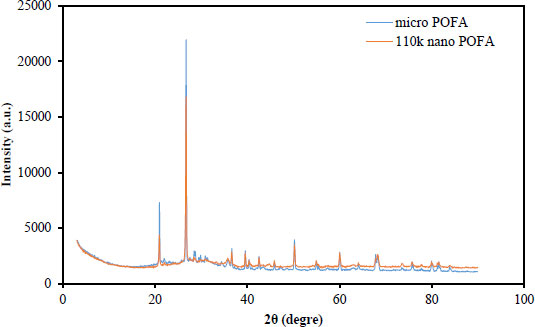
Micro POFA and 110k cycles nano POFA had a similar trend in the XRD result of micro POFA, as shown in Fig. (2), and the major mineral phase detected was the quartz. Besides that, a hump peak was found between 19 to 36.5 in both types of POFA, which indicated the low crystallinity of the micro and nano POFA. This hump peak of the sample’s XRD result found in this research aligned with that reported earlier [22, 36, 38], where the hump was found at a degree ranging between 15° to 40°. The second grinding process was found to decrease the peak intensity of 110k nano POFA, which was 27.8% less than the peak intensity of micro POFA. A similar decrement of peak intensity in SCM’s XRD result has been reported previously [43, 44] due to the grinding process, and this reduction indicated the reduction in crystallinity of quartz to a finer size. This was unlike the XRD result reported in a previous study [18], where the peak intensity of the nano POFA increased after being ground from micro to nanoscale in the high-energy ball milling machine. This increment aligned with the warning suggested in another work [28] due to the high grinding speed, which later increased the crystal size of quartz.
| Chemical Component (%) | Raw POFA | Sieved POFA | Micro POFA | 80k Cycle Nano POFA |
|---|---|---|---|---|
| MgO | 1.90 | 2.99 | 2.96 | 2.68 |
| Al2O3 | 0.69 | 2.28 | 6.36 | 7.08 |
| SiO2 | 13.7 | 32.1 | 58.0 | 58.6 |
| SO3 | 2.19 | 1.14 | 1.58 | 1.02 |
| K2O | 8.67 | 7.27 | 9.49 | 8.01 |
| CaO | 3.29 | 7.28 | 9.03 | 8.04 |
| Fe2O3 | 1.34 | 3.50 | 6.60 | 9.70 |
| Sum of Al2O3, SiO2, and Fe2O3 | 15.73 | 37.88 | 70.96 | 75.38 |
3.1.5. Morphology of POFA
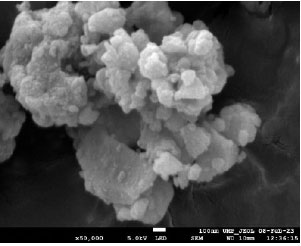
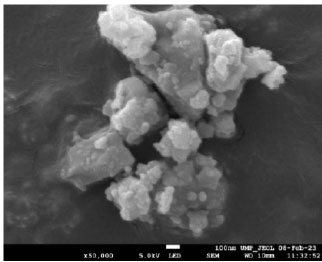
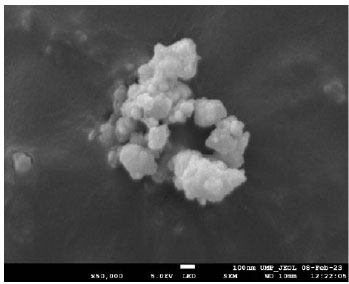
Figs. (3-5) present the morphology of the 50k cycles, 80k cycles, and 110k cycles nano POFA. It was found that all three types of nano POFAs’ particles tended to be aggregated with other particles and formed a bigger particle, which was similar to the result reported by Wi et al. [36]. Apart from that, the 50k cycle nano POFA particles had an angular shape with more edges, but the 80k cycles nano POFA had an angular shape with fewer edges than the 50k cycles. The 110k cycles nano POFA’s particle was between angular and circular. Comparing the particle size among these three types of nano POFA, the 110k cycles nano POFA’s particle seemed smaller compared to others, according to the result of the particle size analyzer.
3.2. Fresh Properties of Mortar Containing POFA
The flowability of the mortar was assessed to examine the effects of different combinations of micro and nanoscale POFA as partial cement replacements. The flow diameter is presented in Table 5. It is evident that increasing the dosage of micro POFA had a greater impact on the flow diameter compared to increasing the dosage of nano POFA or the number of grinding cycles for nano POFA. When the dosage of micro POFA was increased to 30% in the mortar mix, the flow diameter decreased, compared to the mix with 10% micro POFA and the control sample. On the other hand, incorporating higher dosages of nano POFA, regardless of the grinding cycles, resulted in an improvement in the flow diameter of the mortar, particularly when combined with higher dosages of micro POFA (20% and 30%). This trend in the improvement of flow diameter aligns with the findings of previous studies [19, 20, 45]. The enhanced flow diameter in mortars containing 20% to 30% micro POFA can be attributed to the contribution of the fine particles of nano POFA. Due to its very fine particle size and lower specific gravity compared to OPC, nano POFA particles can adhere to the cement particles, which are negatively charged, preventing flocculation and agglomeration. As a result, the cement particles disperse more evenly, allowing for less water entrapment [26, 45]. Hamada et al. [46] and Zeyad et al. [38], who used fine POFA with the particle size of 2.06 μm and 0.982 μm as cement replacement in their concrete mix design, also reported an increment in workability of concrete as the replacement rate increased. The addition of fine POFA, with its lower specific gravity and finer particle size, increased the binder volume, improving coating, lubrication effects, and filling the voids between aggregates [47].
The LOI value of the three nano POFA samples was observed to be higher than that of the micro POFA, as well as the LOI values reported in previous studies ranging between 0.09% to 4.62% [21, 40, 46, 48]. However, these LOI values were still within the limits specified in ASTM C 618. Interestingly, the mortar's flow diameter showed a slight increase with increasing dosage of nano POFA, but the opposite trend was observed with increasing substitution rate of micro POFA. This suggests that the particle size of POFA has a greater impact on the flowability of the mortar compared to the LOI value. When comparing the effects of different grinding cycles on the flowability of the mortar, it was found that the 110k cycles nano POFA provided slightly better improvement compared to the 50k and 80k cycles. However, overall, the difference between the grinding cycles was not significant. Therefore, it can be concluded that in this experiment, the optimum dosage of nano POFA was more crucial in improving the fresh properties of the mortar compared to the grinding cycles and LOI value.
| Mix No. | 50k Cycles Nano POFA | 80k Cycles Nano POFA | 110k Cycles Nano POFA |
|---|---|---|---|
| M0 | 120 | 120 | 120 |
| M10N1 | 115 | 120 | 120 |
| M10N2 | 122 | 120 | 118 |
| M10N3 | 120 | 115 | 120 |
| M20N1 | 113 | 115 | 120 |
| M20N2 | 115 | 113 | 114 |
| M20N3 | 120 | 120 | 120 |
| M30N1 | 115 | 113 | 115 |
| M30N2 | 118 | 116 | 119 |
| M30N3 | 121 | 120 | 124 |
3.3. Hardened Properties of Mortar Containing POFA
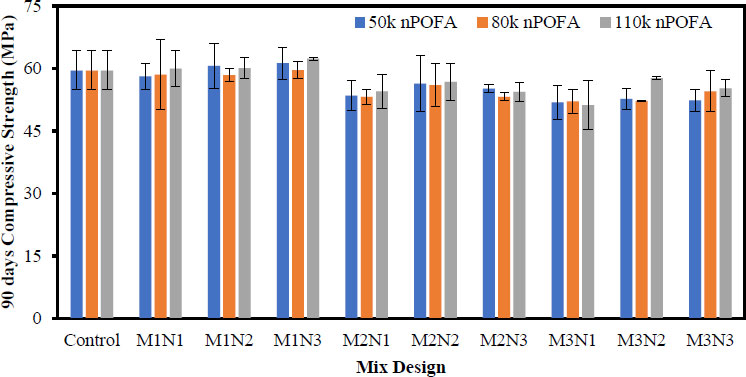
Compressive strength is the utmost important parameter for evaluating the properties of cement-based material at different curing ages. Hence, this parameter has been utilized for assessing the impact of mix design and the grinding cycle on the mortar mix that was partially replaced by micro and nano POFA. Tables 6-8 present the compressive strength of mortar that contained various combinations of micro and three levels of grinding cycles of nano POFA, while Figs. (6-8) present the trends of various mortars’ compressive strength at the curing ages of 7, 28, and 90 days.
Mortar that contained 10% micro POFA and 2% to 3% nano POFA without considering the impact of grinding cycles performed better than other combinations of micro and nano POFA. Further increasing the micro POFA replacement rate only led to a reduction in compressive strength at all curing ages. On the other hand, increasing the dosage of nano POFA despite the grinding cycles was found to improve the compressive strength of mortar that was substituted by a different rate of micro POFA at all curing ages. At the early curing age of 7 days, the mortar that contained 10% micro POFA and 2 to 3% nano POFA had higher compressive strength than the control in the range of 5.96 to 7.9%. While at the curing ages of 28 and 90 days, the M10N2-3 mortar had a relatively higher compressive strength of 1.48% and 4.6%, respectively, than the control. M20 mortar that contained 2 to 3% nano showed a reduction in compressive strength of 5%, 14%, and 6.07%, than the control at the ages of 7, 28, and 90 days. Compared to the M20, M10 mortar, and control, the M30 mortar exhibited a higher reduction in compressive strength, where a reduction rate of 14%, 12%, and 10% was found at the respective curing ages.
The inversely proportional trend between the substitution rate of micro POFA and the mortar’s compressive strength, especially at the early curing age, has also been reported previously [22, 24, 36, 47, 49]. The micro POFA, which had a more porous particle, absorbed more water, and thus reduced the free water content for cement hydration; as the dosage of micro POFA increased, more water was absorbed and led to a higher reduction in cement mixture [20, 46]. In addition, increasing the replacement rate of SCM reduced the portion of cement at the same time. This led to the dilution of cement, where a lesser amount of calcium hydroxide (CH) was produced from the hydration process, while the CH was needed for the pozzolanic reaction. Hence, a lower quantity of the pozzolanic product, CSH gel, was produced and caused a reduction in the pozzolan-cement-based mixture’s compressive strength with the replacement rate that exceeded the optimum rate [22, 49, 50]. Unlike the micro POFA, a positive increment trend was found in the compressive strength of mortar as the dosage of nano POFA increased. The finer particles of nano POFA demonstrated better pozzolanic reactivity as well as pore filling effect in the cement mixtures [22, 24]. Therefore, utilizing the nano POFA at the dosage of 3% incorporating 10% micro POFA as cement replacement in mortar led to an increment in mortar’s compressive strength in the range of 6.4% to 7.6% at 7 days, 0.73% to 1.47% at 28 days, and 2.75% to 4.6% at 90 days.
There was a trivial difference found in the mortar’s compressive strength at all curing ages when the three types of nano POFA were used. At the 7-day curing age, the mortar that contained 50 cycles nano POFA exhibited the highest compressive strength, followed by 80k cycles nano POFA, and the 110k cycles nano POFA had the lesser compressive strength. However, the trend changed at 28 and 90 days, where the 110k cycles nano POFA’s mortar performed better than the others, and the 50k cycles nano POFA’s mortar came second. This can be attributed to the particle size of various types of nano POFA, where the 110k cycle nano POFA had the finest particle. Hence, the 110k nano POFA-based mortar performed better than the 50k and 80k nano POFA mortar at late curing ages. In addition, the slower strength development of the 110k nano POFA than 50k nano POFA at ealier curing age may be due to the higher LOI value of 110k nano POFA and this led to a slower pozzolanic reaction.
| Mix No. | 50k Cycles Nano POFA | 80k Cycles Nano POFA | 110k Cycles Nano POFA |
|---|---|---|---|
| M0 | 40.74 | 40.74 | 40.74 |
| M10N1 | 38.50 | 38.33 | 37.32 |
| M10N2 | 46.37 | 43.96 | 43.17 |
| M10N3 | 43.34 | 43.79 | 43.83 |
| M20N1 | 39.06 | 36.83 | 38.77 |
| M20N2 | 39.05 | 39.70 | 38.06 |
| M20N3 | 38.39 | 39.05 | 39.76 |
| M30N1 | 35.83 | 35.28 | 35.25 |
| M30N2 | 35.51 | 35.05 | 36.03 |
| M30N3 | 36.10 | 34.17 | 33.57 |
| Mix No. | 50k Cycles Nano POFA | 80k Cycles Nano POFA | 110k Cycles Nano POFA |
|---|---|---|---|
| M0 | 56.93 | 56.93 | 56.93 |
| M10N1 | 53.99 | 53.00 | 55.63 |
| M10N2 | 57.38 | 54.37 | 57.35 |
| M10N3 | 57.77 | 57.38 | 55.12 |
| M20N1 | 48.44 | 49.72 | 48.14 |
| M20N2 | 49.25 | 48.62 | 50.30 |
| M20N3 | 49.57 | 45.26 | 48.57 |
| M30N1 | 42.07 | 44.15 | 46.96 |
| M30N2 | 48.95 | 51.56 | 48.45 |
| M30N3 | 50.54 | 50.70 | 51.17 |
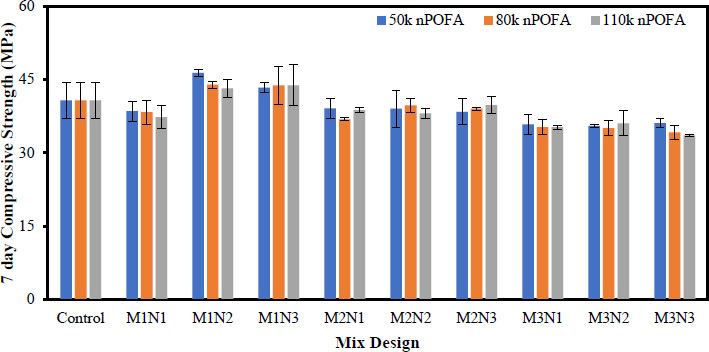
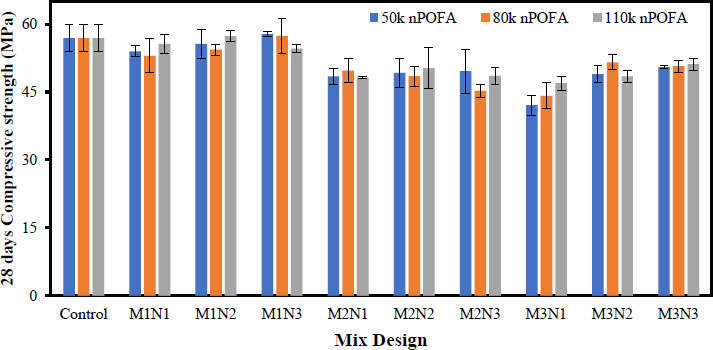
Table 8.
| Mix No. | 50k Cycles Nano POFA | 80k Cycles Nano POFA | 110k Cycles Nano POFA |
|---|---|---|---|
| M0 | 59.62 | 59.62 | 59.62 |
| M10N1 | 58.11 | 58.54 | 59.99 |
| M10N2 | 60.61 | 58.39 | 60.09 |
| M10N3 | 61.26 | 59.62 | 62.36 |
| M20N1 | 53.50 | 53.14 | 54.48 |
| M20N2 | 56.34 | 56.01 | 56.74 |
| M20N3 | 55.15 | 53.18 | 54.40 |
| M30N1 | 51.84 | 52.11 | 51.18 |
| M30N2 | 52.69 | 52.19 | 57.69 |
| M30N3 | 52.32 | 54.54 | 55.24 |
3.3.1. Analyzing Factor-Response Relationship by Using Response Surface Methodology (RSM)
The RSM computed an equation that described the relationship between the factors and responses based on coded factors, as summarized in Table 9. Coded equations can provide the prediction of the response based on factors that have been considered and identify the relative impact of factors by comparing the factor coefficient. The designed factors were the micro POFA replacement rate denoted as Factor A, the nano POFA replacement rate denoted as Factor B, and the grinding cycles of nano POFA denoted as Factor C. The corresponding responses were the compressive strength of mortar at the curing ages of 7, 28, and 90 days. Different order polynomial was selected in each response surface model to meet the level of significance and fit the data with a good correlation coefficient. Hence, the 7-day compressive strength (CS) response surface model was a two-factor interaction (2FL) process order, while the 28- and 90-day CS response surface models were in the quadratic process order.
Analysis of variance (ANOVA) was implemented in each response surface model for interpreting the data, as shown in Tables 10-12. Results have been further expressed in terms of the sum of square, degree of freedom, mean square, F-value, and p-value. All three response surface models demonstrated an F-value of 20.25, 11.67, and 15.14, which indicated these models to be significant. In addition, the p-value model term played an important role in determining the significance of each factor, where a value lower than 0.05 was indicated as significant, and vice versa, a value greater than 0.1000 was not considered significant. In all three response surface models, Factor A and B were significant model terms, while the 7-day CS model had an additional significant model term as Factor AB; however, an additional significant Factor A2 was observed in 28- and 90-day CS models. The significant impact of Factors A and B is aforementioned and has been proven in these response surface models. Moreover, at the p-value of Factor C, the grinding cycle of nano POFA was found to decrease near to significant level at late curing age compared to 7- and 28-day curing ages. Smaller particle sizes of SCM particles exhibited better pozzolanic reactivity and enhanced nucleation sites for the reaction [51]. However, due to the small dosage of nano POFA as well as the small deviation of particle size between three nano POFAs, the impact of Factor C was more significant at the later curing age.
| Response | Compressive Strength at 7 Days | Compressive Strength at 28 Days | Compressive Strength at 90 Days |
|---|---|---|---|
| Constant | +38.67 | +49.18 | +54.84 |
| Factor A | -3.43 | -3.75 | -3.29 |
| Factor B | +0.9350 | +1.33 | +0.8433 |
| Factor C | -0.3550 | +0.2072 | +0.5750 |
| Factor AB | -1.61 | +0.9650 | +0.0308 |
| Factor AC | +0.1083 | +0.5050 | +0.4000 |
| Factor BC | +0.1150 | -0.7708 | +0.0892 |
| A2 | - | +3.38 | +1.83 |
| B2 | - | -1.35 | -1.14 |
| C2 | - | +0.5628 | +1.03 |
| Source | Sum of Square | DF | Mean Square | F-value | p-value |
|---|---|---|---|---|---|
| Model | 261.76 | 6 | 43.63 | 20.25 | 0.0001 |
| A | 212.32 | 1 | 212.32 | 98.53 | 0.0001 |
| B | 15.74 | 1 | 15.74 | 7.30 | 0.0137 |
| C | 2.27 | 1 | 2.27 | 1.05 | 0.3171 |
| AB | 31.14 | 1 | 31.14 | 14.45 | 0.0011 |
| AC | 0.1408 | 1 | 0.1408 | 0.0654 | 0.8008 |
| BC | 0.1587 | 1 | 0.1587 | 0.0736 | 0.7889 |
| Residual | 43.10 | 20 | 2.15 | - | - |
| Cor total | 304.85 | 26 | - | - | - |
| Source | Sum of Square | DF | Mean Square | F-value | p-value |
|---|---|---|---|---|---|
| Model | 388.03 | 9 | 43.11 | 11.67 | 0.0001 |
| A | 252.68 | 1 | 252.68 | 68.38 | 0.0001 |
| B | 31.95 | 1 | 31.95 | 8.65 | 0.0091 |
| C | 0.7729 | 1 | 0.7729 | 0.2092 | 0.6532 |
| AB | 11.17 | 1 | 11.17 | 3.02 | 0.1001 |
| AC | 3.06 | 1 | 3.06 | 0.8282 | 0.3755 |
| BC | 7.13 | 1 | 7.13 | 1.93 | 0.1827 |
| A2 | 68.46 | 1 | 68.46 | 18.53 | 0.0005 |
| B2 | 10.92 | 1 | 10.92 | 2.95 | 0.1038 |
| C2 | 1.90 | 1 | 1.90 | 0.5143 | 0.4830 |
| Residual | 62.81 | 17 | 3.69 | - | - |
| Cor total | 450.85 | 26 | - | - | - |
| Source | Sum of Square | DF | Mean Square | F-value | p-value |
|---|---|---|---|---|---|
| Model | 249.50 | 9 | 27.72 | 15.14 | 0.0001 |
| A | 194.50 | 1 | 194.50 | 106.25 | 0.0001 |
| B | 12.80 | 1 | 12.80 | 6.99 | 0.0170 |
| C | 5.95 | 1 | 5.95 | 3.25 | 0.0891 |
| AB | 0.0114 | 1 | 0.0114 | 0.0062 | 0.9380 |
| AC | 1.92 | 1 | 1.92 | 1.05 | 0.3201 |
| BC | 0.0954 | 1 | 0.0954 | 0.0521 | 0.8221 |
| A2 | 20.03 | 1 | 20.03 | 10.94 | 0.0042 |
| B2 | 7.81 | 1 | 7.81 | 4.27 | 0.0544 |
| C2 | 6.37 | 1 | 6.37 | 3.48 | 0.0794 |
| Residual | 31.12 | 17 | 1.83 | - | - |
| Cor total | 280.62 | 26 | - | - | - |
| Response | 7 days Compressive Strength | 28 days Compressive Strength | 90 days Compressive Strength |
|---|---|---|---|
| Coefficient of determination, R2 | 0.8586 | 0.8607 | 0.8891 |
| Adjusted R2 | 0.8162 | 0.7869 | 0.8304 |
| Predicted R2 | 0.7081 | 0.6904 | 0.6965 |
| Standard deviation | 1.47 | 1.92 | 1.35 |
| Mean | 38.67 | 50.90 | 55.99 |
| Adequate precision | 14.1426 | 11.0446 | 11.8960 |
| Predicted residual error sum of square | 88.99 | 139.57 | 85.16 |
| Criteria | Optimization Target | Lower Limit | Upper Limit |
|---|---|---|---|
| Micro POFA (%), A | In range | 10 | 30 |
| Nano POFA (%), B | In range | 1 | 3 |
| Grinding cycles, C | In range | 50,000 | 110,000 |
| Compressive strength (MPa) at 7 days | Maximize | 40.74 | 46.37 |
| Compressive strength (MPa) at 28 days | Maximize | 56.93 | 57.77 |
| Compressive strength (MPa) at 90 days | Maximize | 59.62 | 62.36 |
The coefficient of determination, R2 of each response surface model is presented in Table 13 for testing the models’ adequacy, fitness, and consistency. A model having an R2 value greater than 0.8 and closer to 1 can be considered a good fit with respect to the experiment data [52, 53]. All three models had an R2 value greater than 0.8 and showed that around 14.14%, 13.93%, and 11.09% of data did not closely link to the model. Besides that, the difference between adjusted R2 and predicted R2 was less than 0.2, which showed both terms to be reasonably in agreement with each other [52, 54]. Last but not least, the adequate precision of three response surface models was greater than 4, which is an adequate signal-to-noise ratio; thus, these models can be used to navigate the design space.
3.3.2. Numerical Optimization
The RSM numerical optimization could suggest an optimum input factor to achieve the best performance of the response. In this case, the replacement rate of micro POFA, nano POFA, and the grinding cycles were taken into account to conclude the best solution that achieved the maximum compressive strength at 7, 28, and 90 days (Table 14). As a result, RSM suggested utilizing 10% micro POFA, 2.395% to 3% nano POFA, and the grinding cycle of either 50k cycles or 110k cycles to achieve the maximum compressive strength at respective curing ages. At the earlier curing age, the 50k cycles nano POFA could improve the cement mixture’s compressive strength more efficiently, while the 110k cycles nano POFA based mortar exhibited better performance at late curing age.
CONCLUSION
This paper aimed to evaluate the suitability of using a Los Angeles abrasion machine with a slow grinding speed of 33 rpm with improved grinding parameters to produce nano POFA. Moreover, this research has also attempted to figure out the utilization of nano POFA, having a particle size in the range of 150 nm to 985 nm, as cement replacement in cementitious mixtures. The following can be concluded:
• After being ground in the machine for 50k, 80k, and 110k cycles, the micro POFA was successfully reduced to 529 nm, 325 nm, and 103 nm in size. While the specific surface area of the three types of nano POFA was similar, a small increment trend has been observed with decreasing particle size.
• Upon conducting the grinding process for the second time, the LOI values of all nano POFA increased compared to the micro POFA. While a combination of the thermal treatment and mechanical grinding process improved the sum of chemical content (Al2O3, SiO2, and Fe2O3) to 75.38%. The crystalline phase of the micro POFA and nano POFA demonstrated no significant changes, but a reduction in the peak intensity was found for the 110k nano POFA compared to the micro POFA. Overall, the XRD showed both POFA to be major in quartz with low crystallinity.
• Increasing nano POFA’s dosage led to an increase in the fresh mortar’s flowability. This impacted the mortar’s fresh properties more than different grinding cycles of nano POFA, where the 110k cycles nano POFA mortar has shown a higher flow diameter than the 50k cycle nano POFA.
• In terms of the hardened properties of POFA-based mortar, the mortar that contained 10% micro and 2 to 3% nano POFA performed the most at all curing ages. Increasing the dosage of micro POFA led to a decrement in the mortar’s CS, but the mortars’ strength has been improved by using more dosage of nano POFA. The mortar that contained 10% micro and 2-3% nano POFA had a higher relative CS than the control sample with an improvement rate of 7.9, 1.48, and 4.6% at the 7, 28, and 90 days curing age.
• 50k cycles nano POFA-based mortar performed better in terms of CS than other nano POFA at the curing age of 7 days. However, the 110k cycles nano POFA-based mortar had a higher CS at the following curing ages.
• RSM has been used for describing the relationship between the replacement rate of micro POFA, nano POFA, and the different grinding cycles of nano POFA against the compressive strength of mortar at 7, 28, and 90 days with the aid of mathematical equation. All response surface models showed good agreement with the experiment data, where all models’ R2 value was greater than 0.8, while the difference between adjusted and predicted R2 was less than 0.2.
• Through the numerical optimization, the combination of 10 micro POFA and 2.34% to 3% nano POFA as cement replacement could improve the compressive strength of mortar at all observed curing ages. While the 50k cycles nano POFA-based mortar performed better at 7 days curing age, 110k cycles nano POFA mortar had higher CS at later curing ages.
The use of a low grinding speed LA abrasion machine could produce nano POFA with the proposed grinding parameters. Although a longer time is required to grind the micro POFA to the size of 103 nm, this might make it easier to scale up the production of nano POFA. Concerning the impact of using a nano POFA with particle size ranging from 529 nm to 103 nm, the RSM models showed this factor as insignificant to the replacement rate of micro and nano POFA at all curing ages. It might be due to the low dosage of the nano POFA used in the mix design, improving the mortar’s strength at the optimum replacement rate. Hence, using the low dosage of nano POFA with a coarser particle size in the range of 2 to 3% is suggested for the future work to achieve a balance between strength improvement and economic consideration.
LIST OF ABBREVIATIONS
| LA abrasion machine | = Los Angeles abrasion machine |
| POFA | = Palm oil fuel ash |
| RSM | = Response surface methodology |
| SCM | = Supplementary cementitious material |
| BET analysis | = Brunauer–Emmett–Teller analysis |
| LOI value | = Loss of ignition value |
| XRF | = X-ray fluorescence |
| XRD | = X-ray diffraction |
| SEM | = Scanning electron microscopy |
| CS | = Compressive strength |
| 2FL | = Two-factor interaction |
CONSENT FOR PUBLICATION
Not applicable.
AVAILABILITY OF DATA AND MATERIALS
The data used to support the findings of this study will be available from the corresponding author [C.C] upon request.
FUNDING
This work was financially supported by UMPSA Internal Grant (PGRS 220322) and IIUM-UMP Sustainable Research Collaboration Grant (RDU223222).
CONFLICT OF INTEREST
The authors declare no conflict of interest, financial or otherwise.
ACKNOWLEDGEMENTS
The authors acknowledge the financial support provided by UMPSA Internal Grant (PGRS 220322) and IIUM-UMP Sustainable Research Collaboration Grant (RDU223222).


