All published articles of this journal are available on ScienceDirect.

Typological Damage Fragility Curves for Unreinforced Masonry Buildings affected by the 2009 L'Aquila, Italy Earthquake
Abstract
Background:
Seismic risk mitigation has become a crucial issue due to the great number of casualties and large economic losses registered after recent earthquakes. In particular, unreinforced masonry constructions built before modern seismic codes, common in Italy and in other seismic-prone areas, are characterized by great vulnerability. In order to implement mitigation policies, analytical tools are necessary to generate scenario simulations.
Methods:
Therefore, data collected during inspections after the 2009 L’Aquila, Italy earthquake are used to derive novel fragility functions. Compared to previous studies, data are interpreted accounting for the presence of buildings not inspected due to those being undamaged. An innovative building damage state is proposed and is based on the response of different structural elements recorded in the survey form: vertical structures, horizontal structures, stairs, roof, and partition walls. In the suggested formulation, the combination of their performance is weighted based on typical reparation techniques and on the relative size of the structural elements, estimated from a database of complete geometrical surveys developed specifically for this study. Moreover, the proposed building damage state estimates earthquake-related damage by removing the preexisting damage reported in the inspection form.
Results:
Lognormal fragility curves, in terms of building damage state grade as a function of typological classes and peak ground acceleration, derived maximizing their likelihood and their merits compared with previous studies are highlighted.
Conclusion:
The correction of the database to account for uninspected buildings delivers curves that are less “stiff” and reach the median for lower peak ground acceleration values. The building feature that influences most the fragility is the masonry quality.
1. INTRODUCTION
In countries exposed to earthquakes, the evaluation of possible consequences is of fundamental importance for the optimization of emergency management and for risk mitigation policies. Among such consequences, the estimation of possible damage to buildings is foremost.
In the literature, there are many models, empirical [1-3] or mechanical [4, 5], for the estimation of damage due to earthquakes by means of the definition of damage probability matrices [6-9] or fragility curves [10,11, 8]. The empirical methods were developed since the 1970s [12], based on the observed damage surveyed after earthquakes, and considering the definition of typological classes [3, 10, 11] or a vulnerability index as a function of different structural parameters [6, 13-16, 9]. The analytical or mechanical models have been largely developed in the last few years as a consequence of increased computation capacity that allowed the definition of more complex numerical models [2, 17, 18]. These methods, based on the performance-based design, evaluate the building vulnerability comparing capacity and demand curves in terms of spectral acceleration or displacement [19], or damage thresholds and damage indexes. The validation of this method requires a comparison with experimental tests. Finally, the hybrid methods combine empirical and mechanical methods employing observed data supplemented by simulated numerical model data [20, 21].
All methods aim to estimate structural damage [22, 23] to assess repair costs and, therefore, determining the amount of funds to be allocated for reconstruction. Alternatively, one can consider usability [24], i.e. the ability of a building to be occupied after a seismic event [7, 25, 9]. In fact, in Italy, during the reconstruction phase following the 2009 L’Aquila earthquake, a criterion for the allocation of resources was based on usability categories [26-28]. In this context, Rosti et al. [7] correlated the structural damage, defined by means of damage indices, to the usability outcome. Instead, Sisti et al. [29], using data from the 2016 central Italy earthquake, showed a strong correlation between the usability outcome and some structural features. In this regard, Zucconi et al. [15, 25, 30, 9] have proposed an empirical model for the probabilistic prediction of the usability outcomes as a function of a usability index based on building features.
Recently in Italy, data observed after earthquakes occurred in the last fifty years have been made available by the Italian National Civil Protection Department and published on the Da.D.O. platform (Observed Damage Database) [21]. The main aim of this dissemination is to promote the development of large scale vulnerability assessment methodologies based on the definition of fragility curves for typological classes representative of the Italian building stock.
Therefore, the focus of this work is the calibration of typological damage fragility curves for unreinforced masonry buildings as a function of Peak Ground Acceleration (PGA). The proposed model is based on the statistical processing of data collected after the 2009 L'Aquila earthquake. A building’s damaged state is hereinafter defined to express, in a synthetic and representative way, the overall damage of a building based on the damage level of its elements and their relative size. Then, fragility curves are developed, identifying the most relevant parameters and the most vulnerable typological classes.
2. MATERIALS AND METHODS
2.1. Intensity Measure Characterization
For the development of damage fragility curves, the selection of a representative intensity measure to be assigned to each building in the database is necessary. Several intensity measures, e.g. macroseismic intensity, PGA, peak ground velocity, and spectral acceleration for a given period of vibration, are available in the fragility-curves literature.
The macroseismic intensity has been largely used in the past decades due to being applicable to historical seismicity and whenever the density of instrumentation is inadequate. Nevertheless, the macroseismic intensity is attributed to conventionally and is based on building performance, hence suffering to a varying extent from the building portfolio affected by the shaking. Moreover, hazard studies in terms of macroseismic intensity are not systematically available making the preventive use of this intensity measure not straight- forward. Conversely, ground motion intensity measures are structure-independent and available in post-event shakemaps [31]. Among them, PGA is usually the most popular intensity measure being available in most hazard studies. Additionally, PGA is the intensity measure chosen by the Italian National Civil Protection Department for seismic damage scenarios and risk analyses [32]. Therefore, in the following sections, PGA is assumed for deriving fragility curves.
PGA data have been made available by the Italian National Institute of Geophysics and Volcanology by means of shake- maps, related to earthquakes that have occurred since 2008. In particular, raw data related to the shakemaps of the 2009 L’Aquila earthquake [33] (http:// shake map.rm.ingv.it/shake /18953 89/products.html) is considered for the following analyses. The shakemap PGA values vary in the range 0.02-0.48 g, with a step of 0.04 g. These values are herein regrouped in bins, with a 0.10 g step, and the central value of each bin is chosen as the categorical value of the bin (Table 1), the only exception being the first bin for which a 0.05 g step is considered. Bins with a systematic step of 0.05 g have been tested without getting any significant improvement compared with the results presented herein. The categorical values of Table 1 have been assigned to each building present in the database as a function of its location on the map.
|
Bin [g] |
Category [g] |
| < 0.05 | 0.025 |
| 0.05 to < 0.15 | 0.10 |
| 0.15 to < 0.25 | 0.20 |
| 0.25 to < 0.35 | 0.30 |
| ≥ 0.35 | 0.40 |
2.2. L’aquila Earthquake Database
On April 6th, 2009, the Abruzzi region was struck by a MW 6.3 earthquake, with epicenter located in the city of L’Aquila seriously damaged. Moreover, approximately 125 municipal- ities were involved in the seismic event, with an intensity measure ranging from V to IX grade of Mercalli-Cancani-Sieberg macroseismic scale (IMCS).
After the earthquake, approximately 75000 buildings were inspected within a survey coordinated by the Italian National Civil Protection Department, with the aim to collect geometrical, structural, damage information and tag the construction in terms of usability. The inspection data were recorded in the Italian AeDES Form “Level 1 Form for Post-Earthquake Damage and Usability Assessment and Emergency Countermeasures in Ordinary Buildings” [34].
From the original database, a subset of approximately 60 000 masonry buildings is considered in the following elaborations. In particular, forms are discarded if:
- The vertical structure is unknown or made of reinforced concrete or steel;
- The structure is not described in terms of quality of masonry, type of horizontal structure, presence of tie rods or tie beams;
- Footprint area is not reported;
- Damage fields are not filled in;
- Damage level and usability outcome are inconsistent (e.g., heavy damage associated with usability or no damage associated with an unusable building);
The remaining buildings amount to 58,365 belonging to 477 settlements, located in 125 municipalities. A description of the database, in terms of building features and performance, is provided by Zucconi et al. [25, 9].
To take into account the actual number of buildings present in the studied area, the subset is increased with an estimation of the undamaged buildings not inspected after the earthquake. In general, the buildings are inspected systematically only in the epicentral area, or near field, while further away from there, the alternatively-called far field, the inspection takes place only at owners' request. The stakeholder is prone to request an official inspection only if the building is damaged. The number of buildings to be added is estimated considering a methodology proposed by Zucconi et al. [25,30], based on the comparison between the number of buildings present in AeDES database with that present in the census (ISTAT 2001) [35]. The final analyzed database, with additional undamaged buildings generated with a Monte Carlo simulation, includes more than 110 000 items and avoids an overestimation of damage occurrence. The relevant aspects of this correction of the database are highlighted in the following sections compared to previous studies.
3. RESULTS AND DISCUSSION
3.1. Typological Classes
The evaluation of territorial-scale seismic fragility curves requires accounting for building features. This operation is performed by means of expert-judgment-defined typological classes, grouping together buildings with similar construction details. In the literature, different typological classifications have been proposed over the years [36, 3, 10]. Herein are assumed the eighteen typological classes suggested by Rota et al. [3], who considered a dataset of about 150 000 buildings inspected after earthquakes occurred between 1980 and 2002 along the Apennine mountain range, to which also Abruzzi belong. Building classification is related to masonry quality, type of horizontal structures, presence of connections, and number of stories, or the co-existence of masonry and reinforced-concrete vertical structures (Table 2).
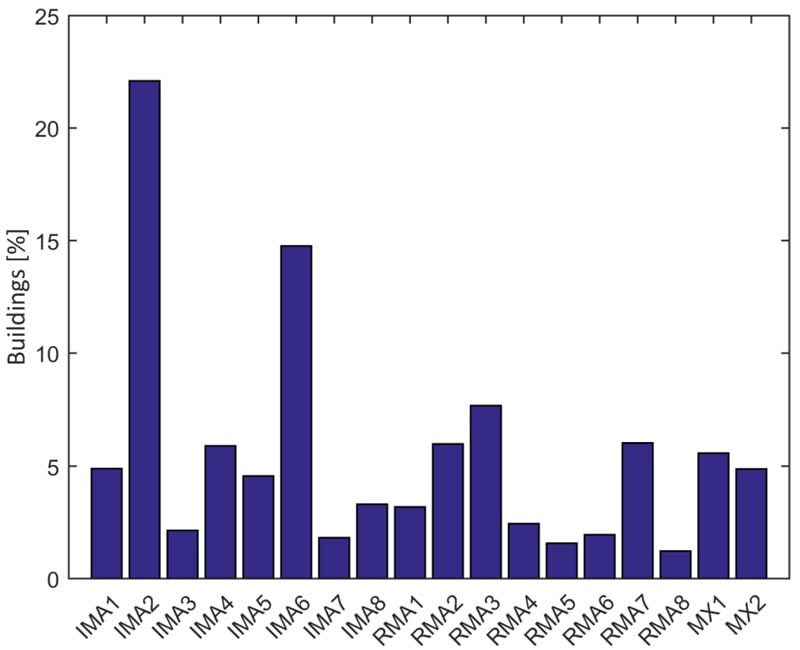
The buildings in the 2009 L’Aquila earthquake database, used in this study, are classified based on section 3 of the AeDES form (Table 3). When more than one vertical structure and/or horizontal structure is selected in the inspection form, the most vulnerable typological class is assumed. The distribution of buildings according to typological classes is shown in Fig. (1), wherein a prevalence of irregular (poor-quality) masonry constructions is evident.
| ID | Description | No. of Stories |
| IMA1 | Irregular masonry with flexible floors with tie rods or tie beams | 1-2 |
| IMA2 | Irregular masonry with flexible floors without tie rods or tie beams | 1-2 |
| IMA3 | Irregular masonry with rigid floors with tie rods or tie beams | 1-2 |
| IMA4 | Irregular masonry with rigid floors without tie rods or tie beams | 1-2 |
| IMA5 | Irregular masonry with flexible floors with tie rods or tie beams | >2 |
| IMA6 | Irregular masonry with flexible floors without tie rods or tie beams | >2 |
| IMA7 | Irregular masonry with rigid floors with tie rods or tie beams | >2 |
| IMA8 | Irregular masonry with rigid floors without tie rods or tie beams | >2 |
| RMA1 | Regular masonry with flexible floors with tie rods or tie beams | 1-2 |
| RMA2 | Regular masonry with flexible floors without tie rods or tie beams | 1-2 |
| RMA3 | Regular masonry with rigid floors with tie rods or tie beams | 1-2 |
| RMA4 | Regular masonry with rigid floors without tie rods or tie beams | 1-2 |
| RMA5 | Regular masonry with flexible floors with tie rods or tie beams | >2 |
| RMA6 | Regular masonry with flexible floors without tie rods or tie beams | >2 |
| RMA7 | Regular masonry with rigid floors with tie rods or tie beams | >2 |
| RMA8 | Regular masonry with rigid floors without tie rods or tie beams | >2 |
| MX1 | Mixed structures (masonry and reinforced concrete) | 1-2 |
| MX2 | Mixed structures (masonry and reinforced concrete) | >2 |
| - | Vertical Structures | |||||
|---|---|---|---|---|---|---|
| Unidentified | Poor Quality Masonry of Irregular Layout (rubble stones, pebbles, ...) | Good Quality Masonry of Regular Layout (blocks, bricks, dimensioned stone units, ...) | ||||
| Without tie rods or tie beams | With tie rods or tie beams | Without tie rods or tie beams | With tie rods or tie beams | |||
| Horizontal Structures | - | A | B | C | D | E |
| Unidentified | 1 | IMA2, IMA6 | IMA2, IMA6 | IMA1, IMA5 | RMA2, RMA6 | RMA1, RMA5 |
| Vaults without tie rods | 2 | IMA4, IMA8 | IMA4, IMA8 | IMA3, IMA7 | RMA4, RMA8 | RMA3, RMA7 |
| Vaults with tie rods | 3 | IMA4, IMA8 | IMA4, IMA8 | IMA3, IMA7 | RMA4, RMA8 | RMA3, RMA7 |
| Beams with flexible slab (timber beams with a single layer of timber boards, jack-arch slab, ...) | 4 | IMA2, IMA6 | IMA2, IMA6 | IMA1, IMA5 | RMA2, RMA6 | RMA1, RMA5 |
| Beams with semi-rigid slab (timber beams with a double layer of timber boards, I-beams and hollow tile blocks, ...) | 5 | IMA2, IMA6 | IMA2, IMA6 | IMA1, IMA5 | RMA2, RMA6 | RMA1, RMA5 |
| Beams with rigid slab (RC floors, beams well connected to RC slabs, ...) | 6 | IMA4, IMA8 | IMA4, IMA8 | IMA3, IMA7 | RMA4, RMA8 | RMA3, RMA7 |
3.2. Damage Survey According to AeDES Form
Section 4 of AeDES form describes damage to structural elements, including vertical (index 1) and horizontal (2) structures, stairs (3), roof (4), and partition walls (5). An additional sixth field is devoted to pre-existing damage, i.e. the damage present before the earthquake, which explains part of the total damage surveyed on the building.
The damage level in each field is described according to severity and extension. As for the first parameter, four severity categories are present: D0, no damage; D1, slight damage; D2-D3, medium-severe damage; D4-D5, very heavy damage or collapse. Extension is defined as a fraction between the damaged surface and the total surface of the structural element (or the whole building in the case of the pre-existing damage). Three categories are proposed in the form: less than 1/3; between 1/3 and 2/3; and more than 2/3.
Several proposals are available in the literature to define the building damage state starting from the damage surveyed with the Italian AeDES form. Most of them are based on a priori assumptions. For instance, Dolce et al. [37] evaluated the damage δi, for the i-th structural element, in a continuous range between 0 and 1 as:
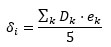 |
(1) |
where Dk and ek are the AeDES damage grade and extension, but whose values to be associated with the form categories are not specified. Then, they evaluate the building damage state, ΔS, as:
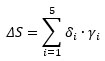 |
(2) |
where γi is the weight of the i-th structural element. Dolce et al. [37] assign such weights based on expert judgment (Table 4, first row), while De Martino et al. (2017) [38] have calibrated their values based on a correlation with observations after the 2009 L’Aquila earthquake (Table 4, second row). De Martino et al. [38] also specify the values for Dk (D0 = 0; D1 = 1; D2–D3 = 2.5; D4–D5 = 4.5), and for ek (Table 5) to be used in Eq. (1).
Alternatively, Goretti and Di Pasquale [39] evalua- ted the building damage state, DS, as coincident with that of the vertical structures alone:
 |
(3) |
with the right-hand side of the equation evaluated as:
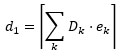 |
(4) |
where the bracket notation with flat ledges on top and no ledges on the bottom involves rounding up to the next greatest integer, because embracing the discrete damage grades in the European macroseismic scale, EMS (Grünthal 1998), varying between 0 and 5. The values for the coefficients on the right-hand side of the equation are given in Table 6.
| - | Vertical Structures, 1 | Horizontal Structures, 2 | Stairs, 3 | Roof, 4 | Partition Walls, 5 |
|---|---|---|---|---|---|
| Dolce et al. (2001) | 0.35 | 0.30 | 0.05 | 0.30 | 0.00 |
| De Martino et al. (2017) | 0.40 | 0.12 | 0.00 | 0.30 | 0.18 |
| - | < 1/3 | 1/3 - 2/3 | > 2/3 |
|---|---|---|---|
| D1 | 0.40 | 0.60 | 0.80 |
| D2-D3 | 0.40 | 0.70 | 0.89 |
| D4-D5 | 0.50 | 0.80 | 0.89 |
| Grade | D0 | D1 | D2-D3 | D4-D5 |
|---|---|---|---|---|
| Dk | 0 | 1 | 2.5 | 4.5 |
| Extension | < 1/3 | 1/3 - 2/3 | > 2/3 | |
| ek | 0.166 | 0.500 | 0.834 |
| AeDES Form | - | |||||
|---|---|---|---|---|---|---|
| D0 | D1 | D2-D3 | D4-D5 | di | ||
| Null | Light | Medium-Severe | Very Heavy | Rota et al. (2008) | Dolce et al. (2017) | Present Study |
| x | - | - | - | 0 | 0 | 0 |
| - | <1/3 | - | - | 1 | 1 | 1 |
| - | 1/3-2/3 | - | - | 1 | 1 | 1 |
| >2/3 | - | - | 1 | 1 | 1 | |
| - | - | <1/3 | - | 2 | 2 | 2 |
| - | <1/3 | <1/3 | - | 2 | 2 | 2 |
| - | 1/3-2/3 | <1/3 | - | 2 | 2 | 2 |
| - | >2/3 | <1/3 | - | 2 | 2 | 2 |
| - | <1/3 | 1/3-2/3 | - | 3 | 3 | 3 |
| - | - | 1/3-2/3 | - | 3 | 3 | 3 |
| - | - | >2/3 | - | 3 | 3 | 3 |
| - | <1/3 | >2/3 | - | 3 | 3 | 3 |
| - | - | - | <1/3 | 4 | 3 | 4 |
| - | <1/3 | - | <1/3 | 4 | 3 | 4 |
| - | 1/3-2/3 | - | <1/3 | 4 | 3 | 4 |
| - | - | <1/3 | <1/3 | 4 | 3 | 4 |
| - | <1/3 | <1/3 | <1/3 | 4 | 3 | 4 |
| - | - | 1/3-2/3 | <1/3 | 4 | 4 | 5 |
| - | - | >2/3 | <1/3 | 4 | 4 | 5 |
| - | <1/3 | - | 1/3-2/3 | 4 | 4 | 5 |
| - | - | - | 1/3-2/3 | 4 | 4 | 5 |
| - | 1/3-2/3 | - | 1/3-2/3 | 4 | 4 | 5 |
| - | - | <1/3 | 1/3-2/3 | 4 | 4 | 5 |
| - | - | 1/3-2/3 | 1/3-2/3 | 4 | 5 | 5 |
| - | - | - | >2/3 | 5 | 5 | 5 |
| - | <1/3 | - | >2/3 | 5 | 5 | 5 |
| - | - | <1/3 | >2/3 | 5 | 5 | 5 |
Rota et al. [3] proposed a direct association between the six damage grades of EMS and the damage reported in the AeDES form. At the element scale, the authors consider only the most severe grade as relevant for the classification (Table 7, fifth column). The same approach is followed by Rosti et al. [7] and Del Gaudio et al. [10], while Dolce et al. [21] account for the full combination of damage grades and extensions getting sometimes different outcomes (Table 7, sixth column). Then, Rota et al. [3] assume the building damage state as coincident with the most severe damage grade of vertical structures (1), horizontal structures (2) and roof (4):
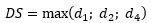 |
(5) |
The same approach is followed by Rosti et al. [7], whereas Dolce et al. [21] and Del Gaudio et al. [10] consider damage only to vertical structures as already done by Goretti and Di Pasquale [39] in Eq. (3).
In order to reduce the role of a priori assumptions of the previous formulations, a different equation may be proposed to estimate the building damage.
3.3. Proposed Building Damage State
Peak damage in a single structural element bears a great relevance to the building performance. For instance, the overturning of a façade will make a building unfit to use, but these phenomena are better accounted for by usability [15]. On the contrary, a building damage state should be related to damage severity and extension as a proxy for future reparation costs [40]. Therefore, an innovative building damage state definition is given based on the size of the structural elements and on typical reparation techniques, rather than expert judgment. The first step to compute this damage state is estimating the surface of each structural element. In the AeDES form, several parameters are available, such as the average floor surface, sf, the number of floors (difference between the total number of floors and number of basement floors), nf, and the average floor height hf. However, these parameters are not sufficient to estimate the surface of the five structural elements whose damage is recorded in the survey form. Therefore, a database of complete geometrical surveys is here collected and interpreted, and, to the authors’ knowledge, it is a first with reference to the Italian building stock of ordinary buildings, whereas statistical information are available for other types of constructions and/or other countries [41, 42]. The geometrical database comprises twenty-five buildings located in historical centers of the province of L’Aquila and involved in reconstruction plans after the 2009 event [ 43].
Based on AeDES available parameters and the geometrical database, the surface (one face only, net of the openings) of the vertical structures, S1, can be estimated as:
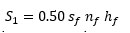 |
(6) |
where 0.50 is a dimensional (m-1) approximate regression coefficient (Fig. 2) based on the detailed geometrical surveys. The estimation of the surface of vertical structures is very robust, as shown by the high coefficient of determination. Fig. (2) shows two buildings with very large S1 values. Similar outliers are present also in the following figures and their relevance will be discussed in the next section.
Based on the previously mentioned geometrical surveys, the total horizontal projection surface of the stairs, Ss, can be assumed as:
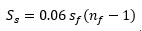 |
(7) |
where 0.06 is a non-dimensional approximate regression coefficient (Fig. 3). A correlation between these parameters is clearly evident but less robust than in Eq. (6), because several surveyed buildings have no internal stairs and take advantage of the ground slope, having a storage area at the bottom floor and the dwelling on the upper floor. Moreover, an intrinsic scatter of actual building configurations for equal simplified geometrical parameters in the AeDES form can be expected and is inescapable. Nonetheless, it is reasonable to assume that, on average, this scatter will be canceled out and the mean performance of a building portfolio, rather than the specific performance of a single building, can still be estimated robustly [44].
The total surface of the internal horizontal structures, S2, can be assumed as:
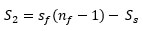 |
(8) |
Based on previously mentioned surveys, the total true-shape surface of the stairs, S3, can be assumed as:
 |
(9) |
where 0.08 is a non-dimensional approximate regression coefficient (Fig. 4), for which the same comments proposed for Fig. (3) apply.
Surveyed roofs have an average angle of 17° on the horizon, with a standard deviation of 5°. Hence, the total true-shape surface of the roof, S4, can be assumed as:
 |
(10) |
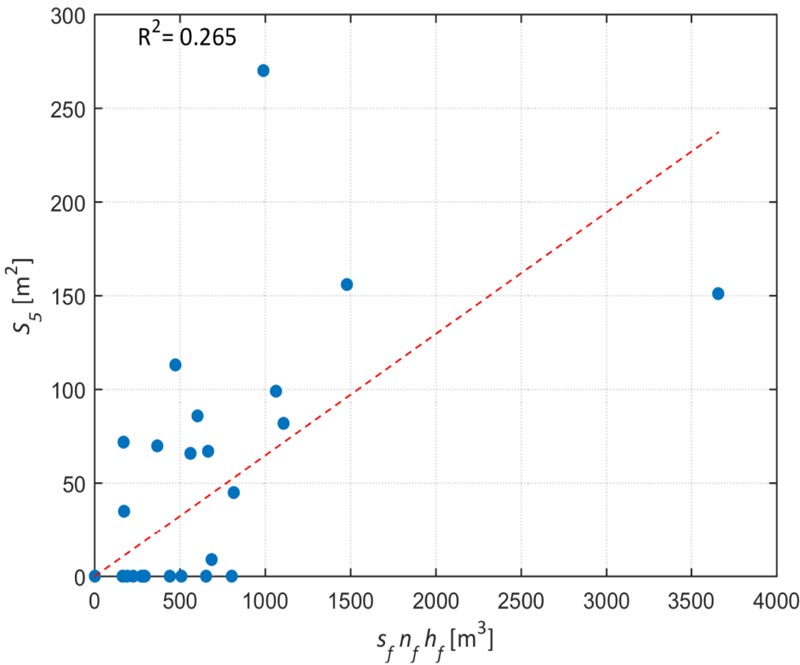
Finally, partitions, occurring just for kitchens, bathrooms, and around stairs, need to be considered. Again based on previously mentioned surveys, the total surface of partitions, S5, can be assumed as:
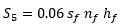 |
(11) |
where 0.06 is a dimensional (m-1) approximate regression coefficient (Fig. 5). The correlation in Eq. (11) shows the lowest coefficient of determination, because the amount of partitions can easily vary from building to building depending on erratic factors such as the size of structural masonry cells, the occurrence and the type of the staircase, the use of the building (no partitions are found in storage constructions). However, the impact of this uncertainty on the building damage state is limited given the small size of this surface in comparison to that of vertical structures (Eq. (6)) and the lower reparation cost of partitions. It is evident from Eq. (6) through Eq. (11), that the largest surface is that of vertical structures.
In order to further pursue a combination of the structural elements’ damage based on data rather than expert judgment, typical reparation techniques have been considered. Already in the last decades, masonry walls were frequently strengthened acting on both faces with a reinforced cement coating [45, 46]. More recently, natural lime plaster and composites have been proposed to enhance compatibility and durability [47]. Hori- zontal structures, such as vaults, floors, roofs, and stairs are repaired with similar techniques, but on one face only [48-50]. Therefore, if a weight w1 = 1.0 is assumed for vertical structures, w2 = w3 = w4 = 0.5 should be assumed for horizontal structures, roof and stairs. Finally, based on the authors’ experience about reparation costs, w5 = 0.3 can be assumed for partitions. Hence, the following innovative building damage state, combining structural-element surface size and reparation-technique weights, can be proposed:
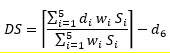 |
(12) |
The single-element damage d i in Eq. (12) is based on damage severity and extension according to Table 7 (last column), which differs from previous formulations in the literature for assessing the most severe damage grades. Parameter d 6 is the building pre-existing damage, that has been neglected in previous studies but it is instead rather relevant, as shown here in after.
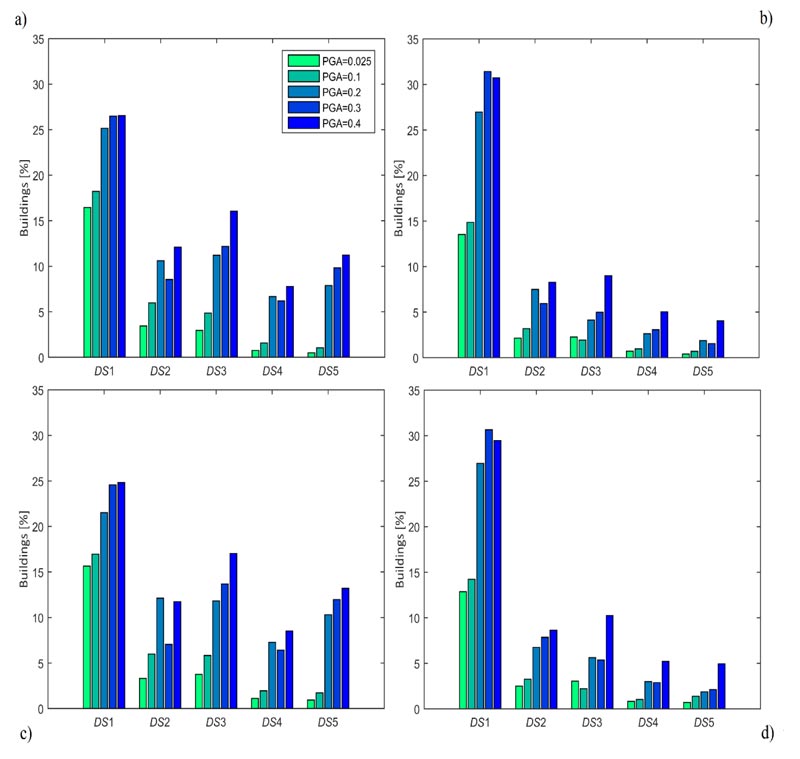
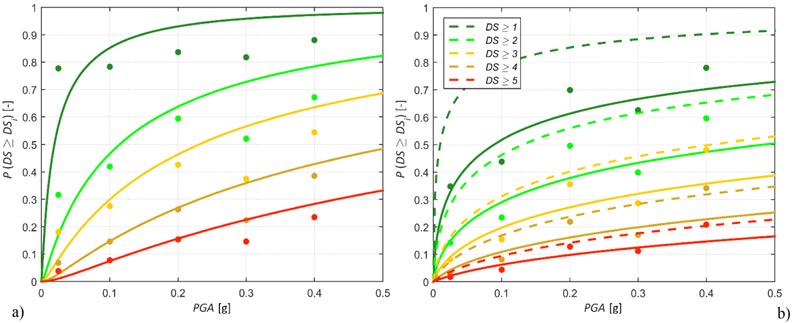
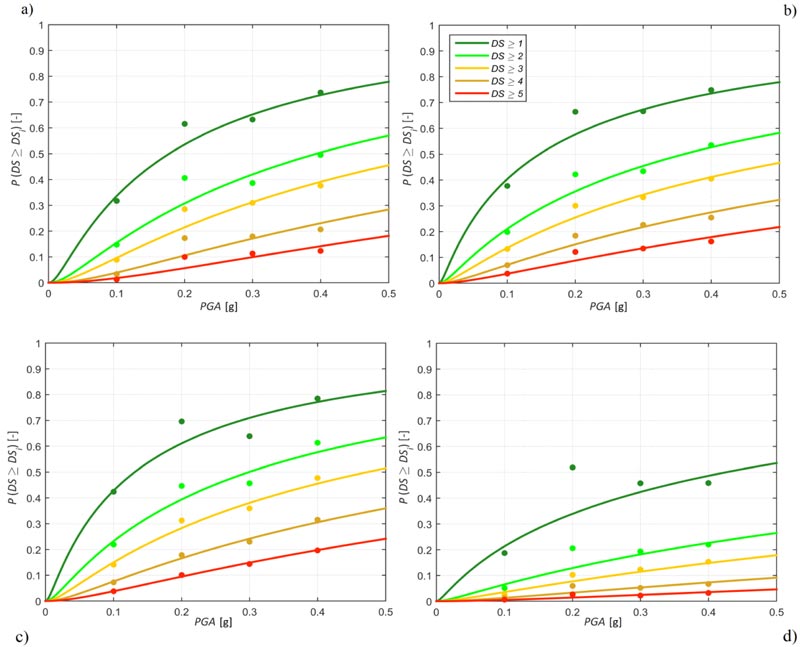
Damage state as defined in Eq. (12) has a relative frequency that increases for increasing PGA in most of the cases, and the relative frequency of exceedance of a damage state diminishes for increasing damage grade (Figs. 6a and b). If the pre-existing damage is neglected, i.e. it is assumed d6 = 0, Figs. (6c and d) are obtained. It is possible to notice that the influence of pre-existing damage is most relevant for low PGA values as well as for low DS values. Such effect is not always intuitive because, although for a single building the damage state is always reduced or equal if preexisting damage is subtracted, the relative frequency of a damaged state for a class of buildings may reduce, stay equal but also increase, in the latter case as a consequence of buildings moving from a higher damage state class. Only DS = 5 relative frequency is always reduced by subtracting the preexisting damage state.
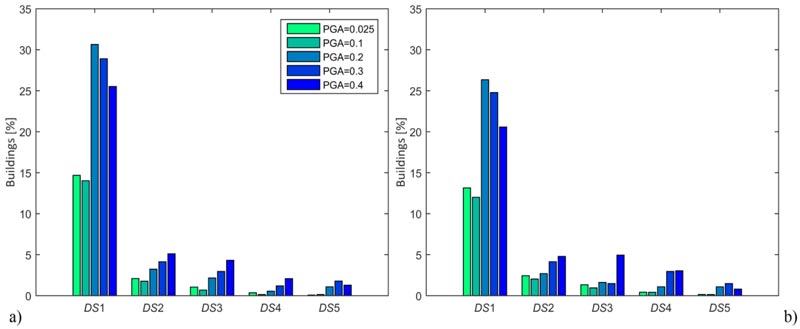
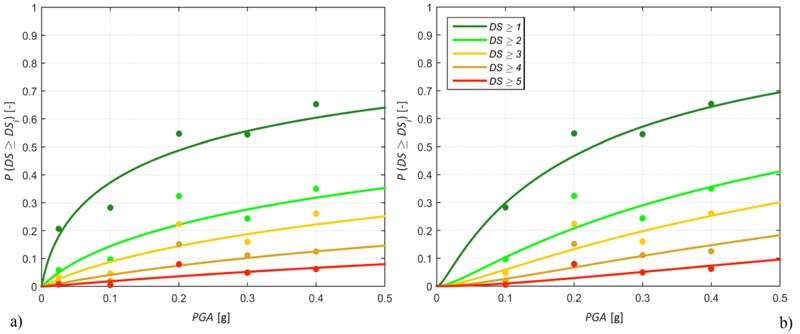
Damage state definition in the present study leads to results, shown in Fig. (7a), not dramatically different from those by Rota et al. [3], shown in Fig. (7b). This outcome is due to vertical structures heavily influencing Eq. (12) and being in most of the cases the most damaged element as shown in Eq. (3). Hence, this assumption in Rota et al. [3] is here confirmed, based on a more general model. Nonetheless, some differences are still present, especially for DS = 1, as a consequence of the subtraction of preexisting damage performed in Eq. (12) but not in Eq. (3).
3.4. Fragility Curves
This section describes the methodology adopted to develop fragility curves, providing the probability of exceeding a specific building damage state defined according to Eq. (12). First of all, the observed damage state relative frequency is computed for each categorical PGA (Table 1) and each typolo- gical class (Table 2). Then, the discrete cumulative frequency distribution is computed and it is fitted with an analytical function (Fig. 8a). Among the different functions available in the literature, the lognormal distribution is the most frequently used [3, 51, 10] and is adopted in the following:
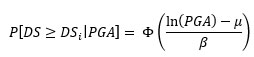 |
(13) |
where P[DS ≥ DSi|PGA] is the probability of exceeding a specific damage state grade DSi given the PGA value; Φ(∙) is the standard normal cumulative distribution function, µ is the logarithmic mean and β is the logarithmic standard deviation.
The parameters µ and β are evaluated with the maximum likelihood estimation method [52, 53]. First of all, the likelihood function is defined as:
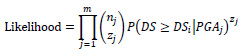 
|
(14) |
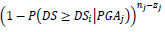
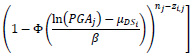
where Π is the product operator over values from 1 to m PGA bins and the binomial distribution is assumed to express the probability  that, for the j-th bin, zj buildings exceed the damage state, while nj-zj buildings do not exceed that damage state with a probability
 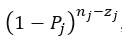 , with nj the total number of buildings in the bin. Finally,
  is the binomial coefficient defined as:
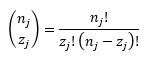 |
(15) |
The probability P is evaluated with the lognormal distri- bution of Eq. (13). Then, the parameters are estimated maximizing the logarithm of the likelihood function [52] with the equation:
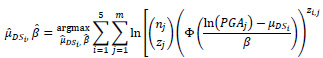 
|
(16) |
Contrary to previous studies on the seismic fragility of unreinforced masonry constructions, but as suggested in general by Porter [54], the same logarithmic standard deviation β is assumed for all DSi to avoid the intersection of the curves.
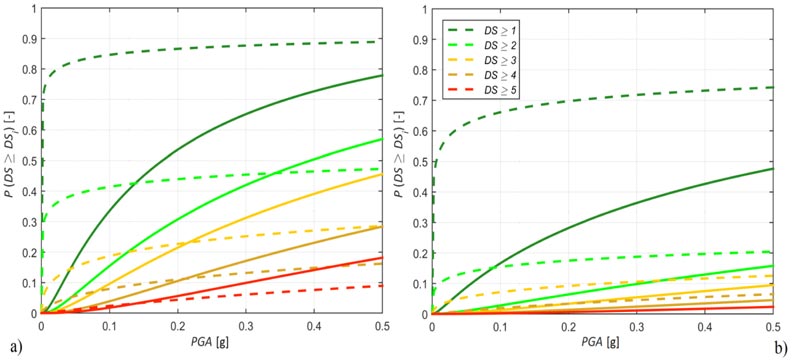
The number of buildings nj is very relevant for the shape of a fragility curve. The most frequent strategy in the literature is that of assuming the number in the AeDES database but considering only settlements that meet some criteria. Goretti and Di Pasquale [39] include only municipalities where more than 65% of the buildings were inspected, while Rota et al. [3] assume a 60% threshold. Del Gaudio et al. [55, 10] take into account only settlements with PGA > 0.05 g and IMCS > VI. All previous authors perform no further correction on the database. As mentioned in Sect. 3, here a different approach is pursued and the number of buildings nj is derived from both AeDES and census data in order to account for undamaged buildings not inspected in the far field. If uninspected buildings are neglected, the fragility curve is much “stiffer” for low intensities and then increases very slowly. On the contrary, if uninspected buildings are accounted for, damage probability for low intensities is much lower (Fig. 8b).
The increase of the database for the lowest intensity-measure bin (PGA = 0.025 g) has been dramatic, from 17830 AeDES-database buildings to 49567 final-database buildings. However, the perusal of the 2009 L’Aquila shakemap shows that entire settlements falling in the lowest-intensity PGA bin are completely unaccounted for in the AeDES database. Therefore, with the same aim to limit the overestimation of damage occurrence, PGA = 0.025 g bin has been completely removed from the final dataset reducing the fragility at low intensities and slightly increasing it at high intensities, as can be observed comparing Fig. (9a) with Fig. (9b).
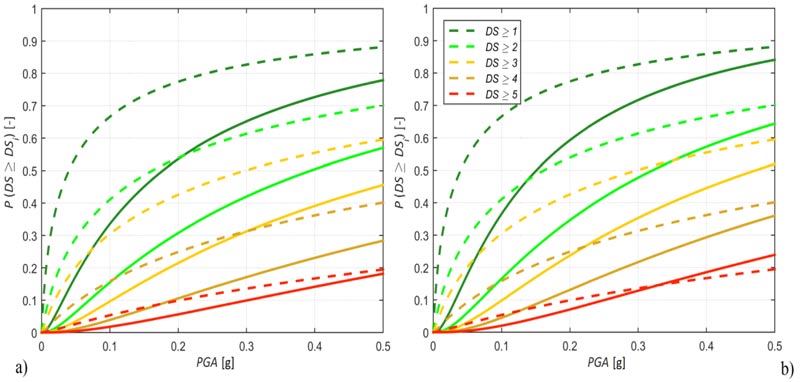
In Fig. (10), damage fragility curves defined according to the present study (solid lines) are compared with Rota et al. [3] curves (dashed lines). The fragility curves by Rota et al. [3] are “stiffer” than those proposed here as a result of previously stated assumptions: removal of buildings belonging to settlements falling in the PGA = 0.025 g, correction of the AeDES number of buildings based on census, subtraction from observed damage of preexisting damage and different damage state definition according to Eq. (12) and Table 7. In addition to these explanations, another one must be considered: Rota et al. [3] performed a weighted fitting of the data and because the far field has more buildings than the near field, the former influenced the final curve more than the latter. However, as already explained, data in the far field is not necessarily more reliable than that in the near field. Therefore, here a simple fitting is carried out.
An additional worthy comparison is that with the fragility curves proposed in Del Gaudio et al. [10], who considered slightly different typological classes. For instance, their 4C class accounts for buildings made of irregular masonry and having flexible floors with tie rods or tie beams, but neglects the number of stories. The most similar classes considered in Table 2 are IMA1 and IMA5, with the same building features but having less than three stories or more than two, respectively. The comparison in terms of fragility curves is proposed in Fig. (11). The distance between the two models is not as dramatic as in the study by Rota et al. [3], also because this study and that done by Del Gaudio et al. [10] are referred to the same earthquake. Nonetheless, there are still relevant differences related to the weights used by Del Gaudio et al. [10] when fitting data, the different treatment of uninspected buildings and the diverse definition of damage state.
In Table 8, the parameters θ = eµ, median of PGA values, and β, logarithmic standard deviation, for the proposed fragility curves are reported for each typological class. It is possible to notice that the median always increases with the DS, contrary to non-monotonic trends in Rota et al. [3] for typological classes MX1, IMA1, IMA3, and seven out of eight regular masonry classes. Additionally, in the present study, there are no intersections between the damage state curves related to the same typological class, even for PGA values larger than those plotted, due to a constant logarithmic standard deviation for all damage state grades. Moreover, as a result of the corrections implemented in the database, a dramatic reduction of the median values can be observed in the proposed fragility curves compared with previous formulations. For instance, typological classes IMA1 and IMA5, in the present study, reach DS = 5 with a 50% exceedance probability for about 1.7 and 1.2 g, respectively, whereas Rota et al. [3] for same classes and damage state show 21.3 and 2.1 g. Del Gaudio et al. [10], for their typological class 4C, as already stated similar to IMA1 and IMA5, present a median value of 3.2 g, substantially higher than those in the present study.
The values in Table 8 have been defined based on the regressions in Figs. (2-5), which however show some outliers. Regression equations have been recomputed removing these outliers and the fragility curves have been reevaluated. However, changes were negligible because the regression equation related to S1, as plotted in Fig. (2), changed only marginally, because S1 accounts for 70% of the total surface in the database and because S1 is multiplied by the largest weight presented in Eq. 12.
The fragility curves described in Table 8 allow to discuss the building features most relevant for earthquake damage. Starting from a building made of irregular masonry having flexible floors with tie rods or tie beams and being one or two stories tall (IMA1, (Fig. 12a)), it is possible to notice that the removal of the tie elements has a limited effect (IMA2, (Fig. 12b)). The same trend was observed regarding usability by Zucconi et al. [9, 15], who ultimately neglected this aspect. Similarly, considering a taller building has a narrow impact (IMA5, (Fig. 12c)), at least up to moderate PGA values. Contrarily, the presence of a regular masonry (RMA2, Fig. 12d) entails a significant decrease of the exceedance probability compared to the presence of an irregular masonry (Fig. 12b), similarly to previous findings based on statistical analysis [9,15], physical testing [56] and numerical simulations [57].
| DS ≥ | 1 | 2 | 3 | 4 | 5 | 1-5 |
|---|---|---|---|---|---|---|
| Typological class | θ | θ | θ | θ | θ | β |
| - | [g] | [g] | [g] | [g] | [g] | [ln(g)] |
| IMA1 | 0.18 | 0.39 | 0.58 | 1.08 | 1.71 | 1.35 |
| IMA2 | 0.15 | 0.36 | 0.57 | 1.08 | 1.81 | 1.59 |
| IMA3 | 0.23 | 0.71 | 1.13 | 2.04 | 3.79 | 1.55 |
| IMA4 | 0.15 | 0.38 | 0.61 | 1.27 | 2.29 | 1.73 |
| IMA5 | 0.15 | 0.32 | 0.47 | 0.77 | 1.17 | 1.20 |
| IMA6 | 0.13 | 0.30 | 0.47 | 0.86 | 1.61 | 1.50 |
| IMA7 | 0.18 | 0.47 | 0.71 | 1.33 | 2.16 | 1.57 |
| IMA8 | 0.13 | 0.30 | 0.48 | 0.87 | 1.49 | 1.57 |
| RMA1 | 0.56 | 2.95 | 5.12 | 9.98 | 16.94 | 1.77 |
| RMA2 | 0.43 | 1.57 | 2.67 | 5.65 | 10.73 | 1.82 |
| RMA3 | 0.74 | 3.88 | 6.61 | 10.87 | 21.54 | 1.69 |
| RMA4 | 0.50 | 1.87 | 3.03 | 6.15 | 12.02 | 1.83 |
| RMA5 | 0.26 | 1.09 | 1.80 | 3.06 | 4.36 | 1.41 |
| RMA6 | 0.21 | 0.70 | 1.09 | 1.97 | 3.34 | 1.48 |
| RMA7 | 0.44 | 1.70 | 2.35 | 3.94 | 6.53 | 1.26 |
| RMA8 | 0.26 | 1.37 | 2.20 | 4.73 | 9.68 | 1.95 |
| MX1 | 0.33 | 1.28 | 2.12 | 4.10 | 8.15 | 1.71 |
| MX2 | 0.26 | 0.72 | 1.02 | 1.79 | 2.59 | 1.24 |
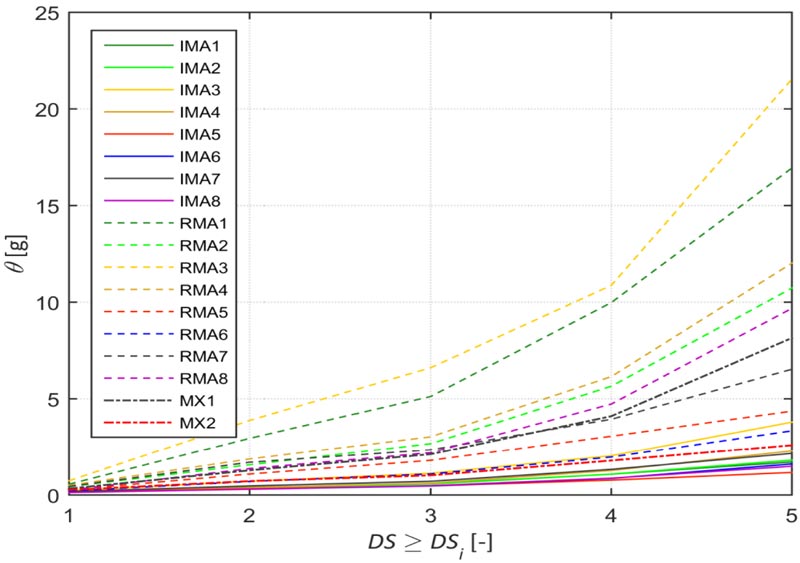
In general, by analyzing the values in Table 8, it is possible to notice a systematic higher vulnerability for all damage states in typological classes having irregular masonry. The same conclusion can be drawn from Fig. (13), wherein the trend of the median for all typological classes and all damage states is plotted. The solid lines related to irregular masonry have a slope systematically lower than that of dotted lines related to regular masonry. Mixed structures (dash-dot lines) are less vulnerable than irregular masonry and more vulnerable than regular masonry.
CONCLUSION
Following the release of data on the inspections carried out after the 2009 L’Aquila, Italy earthquake, damage fragility curves are proposed for unreinforced masonry buildings. Peak ground acceleration is assumed as intensity measure and one of four categorical values is linked to each building in the database. The set of data used in the analyses is not just that of inspections but, based on census, is increased from about 60 000 buildings to about 110 000 to account for buildings that were not inspected due to being undamaged. Each building in the database has been categorized in one of eighteen typological classes proposed in the literature, based on masonry quality, type of horizontal structures, presence of tie rods or tie beams, number of stories, co-existence of unrein- forced-masonry and reinforced-concrete vertical structures. For each database item, a novel building damage state has been defined based on severity and extension of damage to the following elements present in the inspection form: vertical structures, horizontal structures, stairs, roof, partitions. Whereas in the past, expert judgment has guided the suggestion of weights to combine the performance of each structural element, here a new geometrical survey database and typical repair techniques are considered to propose an innovative formulation for the building damage state. Complete geometrical surveys of twenty-five buildings are used to propose formulas to estimate the surface of vertical structures, horizontal structures, true-shape of stairs and roof, partitions, with data available in inspection forms, namely the building footprint area, the number of stories and the average story height. Based on estimated surfaces and typical repair techniques of vertical and horizontal structures, a new building damage state formula is proposed wherein the pre-existing damage is removed from the observed damage in order to get the earthquake-induced damage. Next, discrete relative frequencies of damage state grades are derived and their cumulative distributions are then fitted by lognormal continuous functions. Logarithmic mean and standard deviation of each typological class are assessed by maximizing the likelihood, keeping the logarithmic standard deviation constant for all damage state grades in order to avoid intersections between the curves. The correction of the database for uninspected undamaged buildings delivers fragility functions that reach the median for lower peak ground acceleration values and are less “stiff” compared to curves available in the literature. The proposed lognormal functions show that masonry quality is the most important parameter for damage estimation. Finally, in the future, an approach alternative to typological classes will be explored, resorting to a vulnerability index based on scores and weights given to building features.
CONSENT FOR PUBLICATION
Not applicable.
AVAILABILITY OF DATA AND MATERIAL
The data supporting the findings of the article is available at: http://egeos.eucentre.it/danno_osservato/web/danno_osserv ato?lang=EN.
FUNDING
None.
CONFLICT OF INTEREST
The authors declare no conflict of interest, financial or otherwise.
ACKNOWLEDGEMENTS
The authors wish to thank the Dipartimento di Protezione Civile for granting access to the damage and usability database of the L’Aquila earthquake. This work has been partially carried out under the program “Dipartimento di Protezione Civile – Consorzio RELUIS”. The opinions expressed in this publication are those of the authors and are not necessarily endorsed by the Dipartimento della Protezione Civile.

