All published articles of this journal are available on ScienceDirect.

Permeable Pavements Hydraulic Modelling: An Experimental Study
Abstract
Introduction:
The changes in land use associated with urban development cause an increase in urban flooding. Low Impact Development (LID) systems help to mitigate this hazardous phenomenon.
Methods:
Among LIDs, Permeable Pavement (PP) proved to be a very effective technology in reducing surface runoff. In light of this, the present research analyzes the Retention Capacities (RC) of three different PP samples, which differ in terms of composition and percentage of bitumen and aggregates and have been realized according to Italian national regulations and technical specifications. Hydraulic laboratory tests are conducted using a rainfall simulator to quantify the Retention Capacity (RC) of the three samples in response to rainfall events with different intensities (5, 10, 20, 30 mm/h).
Results:
The values of RC range between 85% and 20%, depending on the rainfall and sample properties, confirming the high potential of PPs in reducing surface stormwater production. The accuracy of HYDRUS-1D model in simulating the surface runoff from the PP samples has been investigated. HYDRUS-1D has been calibrated using measured data of runoff from the laboratory tests and adopting NSE as an optimization criterion.
Conclusion:
The parameters sets obtained by the calibration procedure give back Nash–Sutcliffe Efficiency (NSE) values close to 1 for each PP configuration, which means a very high accuracy in model prediction. Finally, a sensitivity analysis has allowed to identify, by means of a global sensitivity index S, the most and the less influential parameters within the model, which respectively are the saturated hydraulic conductivity Ks (S=0.57) and the tortuosity coefficient L (S=0.015).
1. INTRODUCTION
In recent decades, the population growth and the urban settlments expansion caused a significant increase in the percentage of impervious areas in the form of roads, car parks, driveways, sidewalks, and building roofs which have replaced forested land, crops, agricultural land, and other vegetated areas. The reduction of pervious areas produces an increase in stormwater production, peak rate, and overland flow velocity, resulting in time distribution of the runoff different from the natural pattern [1-3]. The variation in the hydrological cycle causes an increase in both the likelihood and severity of floods in urban areas [4]. Floods have relevant social consequences for communities and individuals, including damage to buildings and other structures and, in the most extreme cases, losses of human lives. In light of this, it is crucial that action is taken to attenuate the effects of damaging events in urban areas [5]. Over recent decades, Low Impact Development (LID) practices have become one of the most popular and effective methods used for managing stormwater and mitigating urban floods. These practices are engineering approaches that mimic natural processes like infiltration, evapotranspiration, and groundwater recharge in order to restore the watershed hydrology before urbanization [6]. LID employs a wide range of devices such as green roofs, bio-retention cells, rain gardens, permeable pavements [7-11]. The Permeable Pavements (PPs) are porous surfaces made up of open-pore pavers which allow the water to pass through the structure rather than running off. They represent an alternative to traditional impervious pavements compared to which they have proved to be more effective, especially from the hydrological point of view; indeed, studies in the scientific literature have demonstrated that porous pavements allow to capture up to 75% of the water falling on their surfaces [12] and retain nearly 100% of rainwater from rainfall events lower than 6mm in depth, without runoff occurrences [13].
Anyway, the retention capacity of the PP systems strongly depends on their composition; indeed, different types of porous media of cementitious materials exist, like cementitious composites reinforced with natural plant fibers [14], reinforced concrete with high porosity [15, 16], fiberglass-reinforced asphalt concrete [17], mortars with recycling of Construction and Demolition Waste (CDW) [18], pervious concrete with the incorporation of a rheology-modifying admixture [19], and pervious concrete with single-size crushed rock [20]. The water retention ranges from maximum values higher than 95% for matrices in açaí fiber-reinforced [14] to minimum values between 15% and 18% for mortar mixed with CDW [18]. The retention capacity also depends on structural factors like the top layer thickness [21] and the layers setting, including the number of sub-base layers [22]; indeed, the higher the depth of the top layer, the larger the runoff retention. Generally, the hydrological performance of a monolithic permeable pavement is higher than the one provided by PP modular form [23]. Regardless of the type of the selected PPs, a successful choice, in order to restore the hydrology of an urban catchment, could be the replacement of the impervious pavements with these systems, since the percent coverage of paved surfaces, excluding roofs, in urban areas, exceeds the 50% [24, 25] and this offers the opportunity of a wide application of LIDs in residential zones with an effective storm flooding reduction. In addition, PPs are very versatile, and they are suitable for different conditions that include less-travelled areas, parking lots, sidewalks, low-traffic areas, driveways, pedestrian areas, low-medium speed areas, alleys, patios, low-water bridges, and much more [26]. Due to the great potential of Permeable Pavements in attenuating storm events, accurate modelling of their hydrological behavior becomes necessary to plan actions in a punctual and focused way for risky areas. Despite this need, PPs, compared to other LID systems, mostly lack extensively tested tools for modeling their hydraulic performances; however, still few models have been proposed in previous researchers for this purpose. Among these, Illgen et al. and Turco et al. [27, 28] used HYDRUS-2D for the numerical analysis of PPs. Palla and Gnecco and, Zhu et al. [29, 30] simulated the runoff production from permeable pavements using Storm Water Management Model (SWMM). Carbone et al. and Brunetti et al. [31, 32] investigated the accuracy of HYDRUS-1D in predicting the hydraulic performance of permeable pavement. Huang et al. [33] introduced a numerical model for simulating the behavior of permeable pavements in stormwater runoff management. Cortier et al. [34] presented a physically-based model built on partial differential equations able to describe the hydrological response of porous pavements. Mahmoud et al. [35] proposed the Windows Source Loading and Management Model (WinSLAMM) method to simulate the stormwater runoff volume produced by a permeable pavement system. It follows that the development and the use of models to reproduce the hydrological behavior of PPs are still limited. The little models’ exploration is a limiting factor in the adoption of these practices [31, 34], so more research is needed in this direction. In light of this, the aim of the present work is to study the response of three kinds of permeable pavement to different rainfall events, in terms of runoff retention, using HYDRUS-1D.
This model has been selected since it has proved to return high fitting between numerical simulations and experimental measurements relating to PP systems. It has been preferred to other models since it requires less computational effort and input data, so even the less experienced users can approach the simulation tasks. In addition, it is readily available to the scientific community since it can be downloaded for free contrary to the same software but for two-dimensional applications (HYDRUS-2D) indeed, the purchase price reflects the complexity of the computational domain [28, 32, 36, 37]. In the end, due to the small size of the samples, the water dynamic is one-dimensional hence the use of HYDRUS-1D which reproduces the one-dimensional flow appeared particularly suitable in the reported study.
Although other works used HYDRUS-1D to reproduce the PP hydrological behaviour, they differ from the present research in the types of investigated PP systems. Indeed the three samples here used have been realized according to the suggestions of “ANAS” (National Autonomous Roads Corporation) and “Autostrade per l’Italia” (leading Italian Concessionaire for toll motorway, management and for related transport services) which are the Italian national competent authorities while the PP analyzed in similar studies have been produced following the technical international specifications of Interlocking Concrete Pavement Institute (ICPI). The latter suggests a layer mainly composed of a mixture of sand, glass sand and zeolite while the Italian standards require a composition including binder and aggregates like sand, basalt, porphyry and filler [31, 32]. In addition, while other works discuss the long-term hydrological performances of the PP under investigation, here, the event scale response has been explored [32]. Furthermore, in contrast to similar event-scale analysis, in the present study, the range of the investigated rainfall intensities is different and wider [31].
In detail, the present research investigates the hydrological response of three PP samples to ordinary, moderate, severe and extremely severe rainfall events with intensities respectively of 5, 10, 20, 30 mm/h. The samples have been realized at SOCOTEC (Society for the Control of Technology) laboratory, in the section of Ferrara, according to the Italian National standard and they differ for the percentage of bitumen and aggregates used during the production phase. At first, for an exhaustive description of the work samples, a mechanic characterization has been performed through the determination of their indirect tensile strength and complex dynamic modulus. As a continuation of the analysis, the hydrological behavior of the three samples, when subjected to storm events with different intensities, has been observed. The hydraulic tests have been conducted in the Maritime and Environmental Hydraulic Laboratory of the University of Salerno using a rainfall simulator. Subsequently, the ability of the physically-based model HYDRUS-1D in correctly reproducing the PPs hydrological response has been investigated. The model has been calibrated coupling the modelling results to measured data collected from the three test pieces during the lab tests. The Nash-Sutcliffe Efficiency (NSE) index has been used as the objective function. Indeed, the calibration parameters set has been iteratively changed until model simulations matched measured calibration data with the highest NSE. In conclusion, a sensitivity analysis has been performed to identify the most significant parameters. The effect of the variance of the parameters on results has been measured by a global sensitivity index.
2. MATERIALS AND METHODS
2.1. The Experimental Setup and Laboratory Tests
Three PP samples (A, B, C) (Fig. 1) have been used within a test programme framwork with the goal of evaluating their runoff response to different rainfall events and verifying the suitability of HYDRUS-1D to accurately reproduce the hydrological behavior.
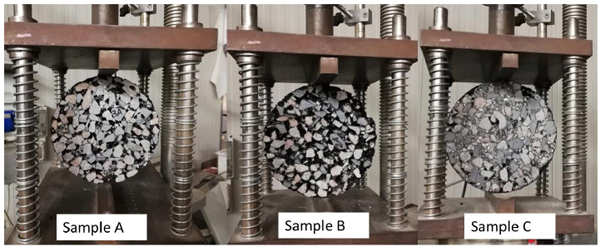
The three work samples have been produced and tested at the Asphalt concrete laboratory of SOCOTEC Italia S.r.l., in Ferrara. They have been realized according to the technical specifications of “ANAS” (National Autonomous Roads Corporation) and “Autostrade per l’Italia” (leading Italian concessionaire for toll motorway, management and for related transport services). The cylindrical samples with a thickness of 6 cm and a diameter of 10 cm, are made up of a mixture of binder and aggregates including sand, basalt, porphyry and filler. The three samples differ in the percentage of the used constituents (Table 1).
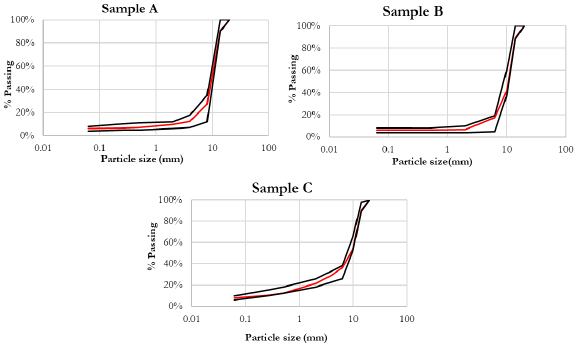
The particle size distribution of the used sediments, for each sample, is shown in Fig. (2)
| Samples | Filler | Sand 0/5 | Basalt 4/8 | Basalt 10/16 | Porphyry 10/16 | Bitumen |
|---|---|---|---|---|---|---|
| A | 6,0% | 5,0% | 18,0% | 12,0% | 59,0% | 5,4% |
| B | 6,0% | 0,0% | 22,0% | 22,0% | 50,0% | 5,4% |
| C | 8,0% | 21,0% | 13,0% | 30,0% | 28,0% | 5,1% |
The binder consists of a 50/70 bitumen modified with 5% of SBS (styrene-butadiene-styrene) polymers. It has been subjected to basic characterization tests for the determination of penetration at 25°C (according to standards UNI EN 1426), softening point (UNI EN 1427), fraass breaking point (UNI EN 12593), elastic recovery at 25°C (UNI EN 13398) and dynamic viscosity at 160°C (UNI EN 13702-2). Results are reported in Table 2.
| Characteristics | Standards | Value | Unit of measure | Range of values |
|---|---|---|---|---|
| Penetration at 25 °C | UNI EN 1426 | 60 | dmm | 50-70 |
| Softening point | UNI EN 1427 | 71,5 | °C | ≥ 70 |
| Fraass breaking point | UNI EN 12593 | -15 | °C | ≤ -12 |
| Elastic recovery at 25°C | UNI EN 13398 | 89 | % | ≥ 80 |
| Dynamic viscosity at 160 °C | UNI EN 13702-2 | 0,38 | Pa x s | ≥ 15 - ≤ 40 |
In addition to the mechanical characterization, the void ratio of each sample has been investigated. The determination of the air voids content has been performed by using a gyratory compactor which combines a rotary shearing action and a vertical resultant force applied by a mechanical head. The void ratio is about 28% for the sample A, 25% for sample B and 12% for sample C. The laboratory tests simulating the rainfall/runoff process, have been performed using a rainfall simulator consisting of a raindrop pipette of 8 cm length and 1.5 cm diameter and a total capacity of 12 ml. The samples, surrounded by PVC membranes, lie over wire grids to hold them in place above a circular plate which acts as a runoff-collecting system. The plate was placed on a high-precision digital calibrated scale which monitored the runoff from the PP samples. For each test, the data collection continued until the runoff stopped. After an event simulation and before repeating the test, the sample was allowed to dry in an oven at a temperature lower than 40° to avoid the melting of the bitumen (Fig. 3).
Four rainfall events have been simulated, they differ in the rainfall intensity, which was set to 5, 10, 20 and 30 mm/h. The rainfall events were replicated by running the rainfall simulator for 10 min respectively at about 0.8 mm (Test 1), 1.8 mm (Test 2), 3.1 mm (Test 3) and 4.9 mm (Test 4). Each test (i) was repeated three times (i’, i”, i”’ for each sample) to quantify measurement uncertainty. The results of each laboratory test have been reported in Table 3 below.
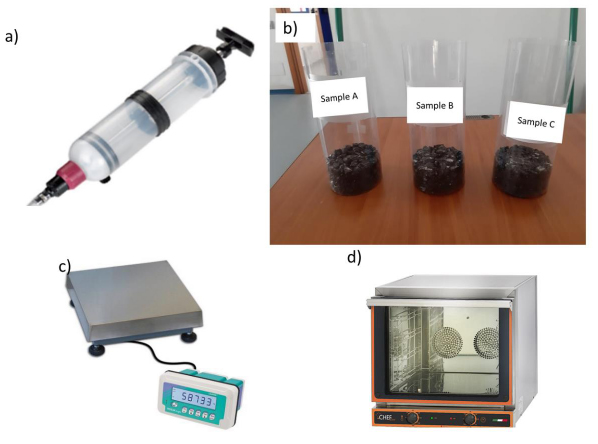
Table 3.
| Samples ID | Test | Rainfall Intensity (mm/h) | Duration (min) | Rainfall Volume (mm) | Runoff Volume (mm) |
|---|---|---|---|---|---|
| A | 1' | 5 | 10 | 0.8 | 0.1 |
| 1” | 0.1 | ||||
| 1”' | 0.1 | ||||
| 2' | 10 | 1.8 | 0.8 | ||
| 2” | 0.8 | ||||
| 2”' | 0.8 | ||||
| 3' | 20 | 3.1 | 2.2 | ||
| 3” | 1.7 | ||||
| 3”' | 1.9 | ||||
| 4' | 30 | 4.9 | 3.4 | ||
| 4” | 3.2 | ||||
| 4”' | 3.2 | ||||
| B | 1' | 5 | 0.8 | 0.1 | |
| 1” | 0.1 | ||||
| 1”' | 0.1 | ||||
| 2' | 10 | 1.8 | 0.8 | ||
| 2” | 0.8 | ||||
| 2”' | 0.8 | ||||
| 3' | 20 | 3.1 | 2.2 | ||
| 3” | 1.7 | ||||
| 3”' | 1.8 | ||||
| 4' | 30 | 4.9 | 3.4 | ||
| 4” | 3.2 | ||||
| 4”' | 3.2 | ||||
| C | 1' | 5 | 0.8 | 0.2 | |
| 1” | 0.3 | ||||
| 1”' | 0.1 | ||||
| 2' | 10 | 1.8 | 1.0 | ||
| 2” | 1.0 | ||||
| 2”' | 0.8 | ||||
| 3' | 20 | 3.1 | 2.4 | ||
| 3” | 2.0 | ||||
| 3”' | 2.2 | ||||
| 4' | 30 | 4.9 | 3.7 | ||
| 4” | 3.8 | ||||
| 4”' | 3.8 |
2.2. HYDRUS-1D and Initial Setting
HYDRUS-1D [38] model has been used in the present work to model the runoff from the considered permeable pavement systems. HYDRUS-1D is a commercial soil physics model for simulating water movement and solute/heat transport in one-dimensional variably saturated media. Its application has provided good results to several types of porous media [32]. Indeed, it has been effectively used in recent studies for the description of the hydraulic behaviour of some LID systems such as green roofs and permeable pavements [31, 32, 39]. The program can be used to reproduce the flow and transport occurring in the vertical, horizontal or sloped direction. HYDRUS-1D is equipped with an interactive graphics-based interface for data-preprocessing/generation and a structured finite element grid system. In addition, the simulation output can be displayed graphically. That is why the model appears very easy and intuitive and immediately intelligible to the users. HYDRUS-1D uses the one-dimensional Richards equation, in the following form, to describe the unsaturated water flow within the media:
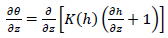
Where θ is the volumetric water content [L3L-3], h is the soil water pressure head [L], K(h) is the unsaturated hydraulic conductivity [LT-1], t is time [T], and z is the soil depth [L].
The soil hydraulic properties are described by the van Genuchten-Mualem relation [40]:
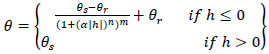
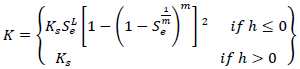
Where θr [L3L-3] is the residual water content, θs [L3L-3] is the saturated water content, n is a pore-size distribution index [-], α is a parameter related to the inverse of the air-entry pressure [L-1], L indicates the tortuosity coefficient [-], Ks [L T-1] is the saturated hydraulic conductivity, m [-] is given by:

The effective saturation Se [-] is expressed as:

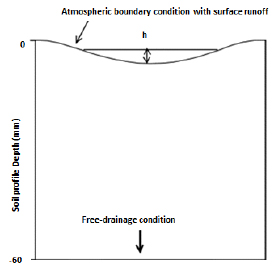
Concerning the initial setting of the model, the atmospheric boundary condition with surface runoff has been applied at the pavement surface while the free-drainage condition has been maintained at the lower boundary of the domain (Fig. 4). The first condition permits water to run off from the surface while the second one is used to simulate a freely draining soil profile. The initial conditions have been specified in terms of soil water content (Vw). Vw has been set to 0.2 (dry condition) and constant with depth. A relatively fine grid (~0.06 cm) has been used for the schematization of the domain while the number of model runs for each simulation has been fixed at 100.
2.3. Model Calibration
Calibration is the process allowing to identify the values of the model parameters which produce outputs that closely match the measurements. The goal of the calibration is to obtain a model that reproduces the hydrological behaviour of the permeable pavement systems as accurately as possible. In general, the adaptation is evaluated using statistical measures called efficiency criteria used as the objective function to judge the performance of the model. In the present study, the Nash-Sutcliffe Efficiency (NSE) index has been used as efficiency criteria while the cumulative runoff volume is the target of the objective function.
The soil hydraulic parameters are simultaneously optimized with the purpose of maximizing the NSE criterion. The NSE coefficient is expressed as:
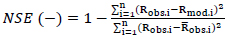
Where n represents the length of the sample which consists of the four rainfall/runoff events simulated during the laboratory tests, Rmod and Robs respectively represent the cumulative modelled and the observed runoff volume,  is the mean of the observed runoff volume. The soil hydraulic parameters required for running the HYDRUS-1D have been listed in Table 4. Field experiments or laboratory tests can be performed in order to experimentally derive the above-said parameters, but these procedures are quite expensive, time-consuming and sophisticated. In order to overcome this limitation, the input parameters are generally estimated using a calibration process or reference values derived by previous studies and suggested for the specific textural class. In the present analysis, the residual water content θr, and the tortuosity coefficient L have been set from scientific literature and fixed respectively at 0.045 and 0.5 as suggested by [28] while the calibration parameters include θs, α, n, Ks.
The calibration procedure provides the best parameter sets to be used as input parameters in HYDRUS-1D during the model simulations.
2.4. Sensitivity Analysis
The sensitivity analysis is generally carried out to evaluate the response of model outputs to variation in input parameters and to quantify the importance of each of them. In this study, one of the main goals is to understand the sensitivity of HYDRUS-1D to the hydrological input parameters so as to identify the most influential one which significantly affects the modelled runoff. A one-at-a-time sensitivity analysis has been performed. In this kind of analysis, each parameter can be tested separately while maintaining all the other parameters fixed to their optimal values obtained from the calibration procedure, so the effect of the single parameter variations can be isolated and identified. The key characteristics of the sensitivity analysis are the selected range of variation for each parameter and the number nj of tested values that segment the variation interval. The extremes of the range of change have been identified according to two criteria. The lower boundary corresponds to the value of the selected parameter which was entered as input within the model, returns no runoff when simulating the event with 5 mm/h intensity. The upper boundary is the value of the considered parameter immediately preceding the one which gives back a non-convergent model solution for the event with the lowest intensity. The number of nj has been established according to the width of the variation interval so that the effect of every value assumed by the tested parameter could be explored (Table 5).
| Samples ID | Parameter | Minimum Input Value | Maximum Input Value | nj |
|---|---|---|---|---|
| A, B | θr | 0.0001 | 0.15 | 6 |
| θs | 0.25 | 0.5 | 6 | |
| α | 0.05 | 1 | 20 | |
| n | 1.5 | 10 | 18 | |
| L | 0.1 | 1 | 10 | |
| Ks | 0.001 | 0.8 | 11 | |
| C | θr | 0.0001 | 0.15 | 6 |
| θs | 0.25 | 0.5 | 6 | |
| α | 0.02 | 2 | 19 | |
| n | 1.5 | 13 | 21 | |
| L | 0.1 | 1 | 10 | |
| Ks | 0.0001 | 0.6 | 11 |
The effects of the physical soil parameters on the model outcomes have been evaluated by their impacts on the value of the global sensitivity index suggested by Saraiva et al. [41] and expressed by:

Where n is the total number of the observed rainfall/runoff events that, in this case, are the four events with rainfall intensities of 5, 10, 20, 30 mm/h. Si is the local sensitivity index of the model concerning the single event [42] calculated as:
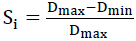
In the previous equation, i represents the index of the event or test (Table 3), Dmax and Dmin are the maximum and minimum values of the output runoff resulting from the change of the considered parameter within the range of variation for the specific event. The total sensitivity index has been selected to estimate the total effect of the input factors because it gives a clear interpretation and a quantitative measure of the relative deviation of the model output distribution.
3. RESULTS AND DISCUSSION
The tests conducted on the three samples allow defining for each configuration and rainfall intensity, the capacity of the PP systems in retaining stormwater. Retention capacity (RCTest) is calculated for each test as:
Where RTEST is the runoff (mm) produced during the test and P is the total volume of the rainfall input (mm).
Each event simulation has been reproduced three times, so three values of the retention capacity have been calculated but due to their high degree of consistency, only the mean value (RC) has been considered. The mean value is given as:
Where n is the number of the tests set at 3 (Table 3).
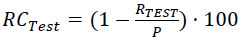
Confidence boundaries at α= 5% have also been assessed. The RC curves derived from the performed analysis for the different combinations of events and PP surfaces are shown in the figure below (Fig. 5). The results show that the capacity in runoff retention decreases with increasing intensities of the rainfall events. Rainfall events up to 2 mm/h have been totally retained by all the samples (RC = 100%). Events with low intensity (5 mm/h) reach values of RC up to 85%, while the percentage of stored rainwater never falls below 20% even for the storms with higher intensities. The curves can be described by an exponential function where RC decreases very rapidly for high intensities, then gradually approaches a plateau which means no significant decrease in runoff retention for events with rainfall intensities higher than 20 mm/h. Indeed, moving from events with the intensity of 5 mm/h to 10 mm/h, RC decreases drastically by about 30%. For higher intensities, it has not been found large variability in the hydrological performances, indeed, RC ranges between 40% and 20%.
These findings have been confirmed by Carbone et al. [31] where it was found out that moving from a rainfall event with an intensity of 12 mm/h to a rainfall event with an intensity of 36 mm/h, the volume reduction decreases from 68% to 60%. The best performing porous pavement in terms of retention is the type A while the less effective one is the type C. The difference in their hydrological behaviour at most reaches 30%. The samples A and B respond similarly to the rainfall inputs, indeed, the corresponding performances, at most, differ of about 4%.
These findings are closely correlated with the values of the void ratio indeed, the samples A and B exhibit similar values of this index, respectively of 28% and 25%, which results in quite comparable RC. The sample C has a lower void ratio (about 12%) impacting its retention performances which are inevitably worse. All seems to confirm the literature outcomes [43, 44] according to which the change in the void ratio influences the Soil Water Content (SWC) and, specifically, the higher the void ratio, the higher the SWC.
The Hydrus calibration allowed to adjust the input parameters value until reaching the highest possible NSE. In this way, the best set of hydrological parameters for the specific PP system has been obtained. The optimal calibration parameters set has been reported in Table 6. The values found during the procedure correspond to very high NSE which are respectively of about 0.9 for samples A and B and about 1 for samples C. This result suggests that the model is very accurate in predicting the hydrological behaviour of the three samples and especially of the sample C, therefore, it could be effectively used in subsequent simulations. The type A-pavement exhibits a response very similar to the type B-pavement, indeed, the values of the calibration parameters are the same. The ability of this model in reproducing the hydrological performance of a PP system has been proved by other studies which tested different types of PP systems [32] and reported NSE values higher than 80%.
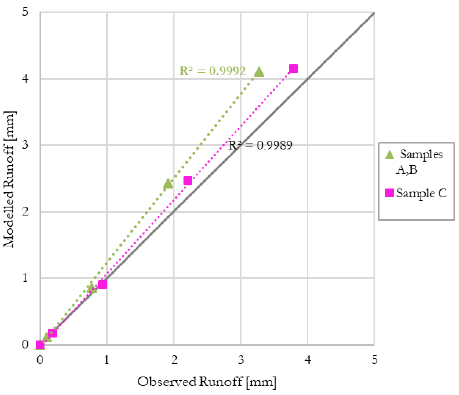
The scatter plot in Fig. (6) confirms that, as a result of the calibration procedure, the observed cumulative runoff values closely match the modelled ones, the fitting is higher for the Samples A and B with a correlation coefficient of 0.9992 and slightly lower for the sample C with R2=0.9989. Anyway, the simulations results will benefit from a very good model efficiency.
| Parameter | Sample A (NSE=0.874) | Sample B (NSE=0.866) | Sample C (NSE=0.980) |
|---|---|---|---|
| θr [mm3/mm3] | 0.045 | 0.045 | |
| θs [mm3/mm3] | 0.3 | 0.3 | |
| α [1/mm] | 0.2 | 0.07 | |
| n [-] | 3 | 2.5 | |
| L [-] | 0.5 | 0.5 | |
| Ks [mm/min] | 0.5 | 0.3 | |
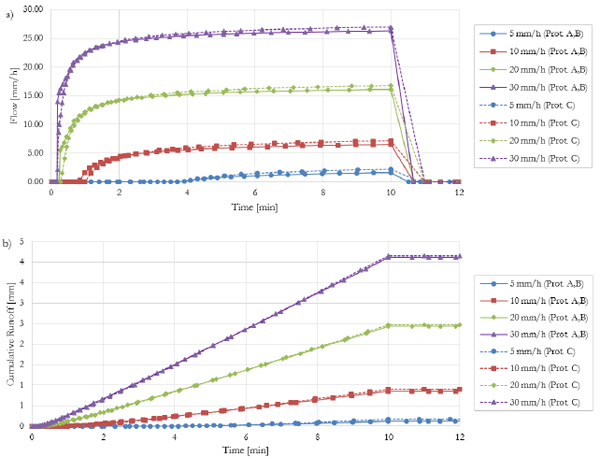
After the calibration process, the temporal patterns of the selected rainfall events have been investigated in terms of runoff flow rate (Fig. 7a) and cumulative runoff (Fig. 7b). The hydrological response, in terms of flow rate (Fig. 7a), corresponding to the different rainfall intensities, present similar temporal patterns that substantially differ in magnitude, indeed, higher intensities correspond to higher rates and consequently higher peak flow. The runoff generation, for events with high intensities, is faster and starts in less than 1 min after the precipitation onset while for low-intensity events, the runoff begins about 4 min later. The runoff production immediately stops at the end of the precipitation input (10 min) regardless of the rainfall intensity of the event. The temporal patterns here presented cannot be compared to experimental measurements that are missing due to the very high sampling rate required consequent to the sample dimension. For what concerns the cumulative runoff volume (Fig. 7b), as the empirical data suggest, the model simulations show that high-intensity events return larger cumulative precipitation than the low-intensity ones. In addition, the behaviour of the samples A and B basically coincide while the sample C is featured by a slightly higher runoff production and peak rate. This result confirms the close link between void ratio and hydraulic behaviour of the samples, indeed, the samples A and B with similar void ratio, around 30%, are better performing than sample C with a lower void ratio (about 12%) and return lower runoff flow rate and cumulative runoff in response to the same rainfall/runoff event.
The sensitivity analysis has allowed, using the global index S, to identify the influence of the different hydrological parameters on the output variance and to discern the unimportant factors which do not significantly affect the model results. In Table 7, the parameters have been ranked starting from the one with the lowest impact on model predictions while the most influential factors are placed on the right side of the table. The parameters with the lowest value of the global sensitivity index are the residual water content θr, and the tortuosity coefficient L. S-index assumes average values of 0.03 and 0.015 respectively for θr and L. This means that the two parameters do not have a direct effect on the output of HYDRUS-1D. This result seems to validate the procedure adopted in the present research and proposed by previous studies [28] which exclude the two above-mentioned parameters from the calibration process by attributing them fixed values from the literature. On the other side, the saturated hydraulic conductivity KS, with a sensitivity index around 0.57, results the most important parameter and uncertainty in its initial value causes uncertainty in the model outcomes. The parameters n, α and θs have a lower impact on the model results than Ks. They return values of S ranging from 0.39 and 0.55. In conclusion, greater attention should be paid to the choice of Ks (and progressively α, θs and n) for a proper simulation process, than in the selection of θr and L. These results are confirmed by other researches [32] which have identified in the pore-size distribution index, the air-entry pressure parameter and the saturated hydraulic conductivity, the most influential parameters on the output’s variance of HYDRUS-1D when the hydrological behaviour of a PP system is investigated. In these cases, the values of the sensitivity indices differ from the ones proposed in the present work, indeed they reach maximum values of about 0.30 against 0.57 of this research, but the order of magnitude is comparable.
Concerning the local sensitivity index Si, it appears to strongly depend on the value of the rainfall intensity of the selected events indeed, the lower the rainfall intensity, the higher the parameter influence on the outcomes of HYDRUS 1D. This implies that the model results are more sensitive to changes in the hydrological parameters for rainfall events with 5 mm/h intensity than for more severe storms (i.e. 30 mm/h), so, the selection of appropriate input values is of higher importance in the reproduction of moderate events. Anyway, also at the local scale, Ks is confirmed to be the most impactful parameter while θr and L are the fewest ones.
For illustrative purpose, the sensitivity graphs for the most and less influent parameters for the sample A have been shown in Fig. (8).
| Samples A-B | |||||||
|---|---|---|---|---|---|---|---|
| i-test | Rainfall Intensity [mm/h] | Si,θr | Si,l | Si,n | Si,θs | Si,𝛼 | Si,Ks |
| 1 | 5 | 0.08 | 0.09 | 0.94 | 0.97 | 0.93 | 0.99 |
| 2 | 10 | 0.01 | 0.02 | 0.38 | 0.45 | 0.60 | 0.67 |
| 3 | 20 | 0.00 | 0.01 | 0.16 | 0.19 | 0.27 | 0.35 |
| 4 | 30 | 0.00 | 0.00 | 0.10 | 0.11 | 0.17 | 0.23 |
| - | S | 0.02 | 0.03 | 0.39 | 0.43 | 0.49 | 0.56 |
| Sample C | |||||||
| i-test | Rainfall Intensity [mm/h] | Si,θr | Si,l | Si,n | Si,θs | Si,𝛼 | Si,Ks |
| 1 | 5 | 0.03 | 0.08 | 0.98 | 0.99 | 0.98 | 0.99 |
| 2 | 10 | 0.01 | 0.02 | 0.48 | 0.54 | 0.67 | 0.69 |
| 3 | 20 | 0.01 | 0.01 | 0.21 | 0.25 | 0.33 | 0.37 |
| 4 | 30 | 0.00 | 0.00 | 0.13 | 0.15 | 0.21 | 0.24 |
| - | S | 0.01 | 0.03 | 0.45 | 0.48 | 0.55 | 0.57 |
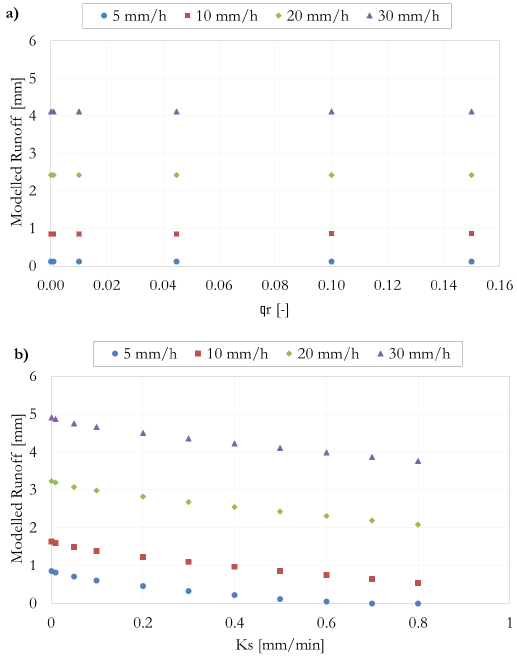
Fig. (8) highlights that for the different rainfall intensities, the variation in the value of θr doesn’t affect the runoff production which remains stable. On the other side, when increasing Ks, the surface outflow consequently decreases. It follows that Ks strongly impacts model results while θr is non-influential within the simulation process.
CONCLUSION
The novelty of the present work lies in the quantitative assessment of the hydrological behaviour of three PP systems with reference to the rainfall characteristics defining how the response varies depending on the specific mechanical features and composition of the samples. The samples used in the present study which differ in terms of the used percentage of aggregates and bitumen, have been selected because recommended by the Italian national competent authorities, and they have never been tested to this aim indeed, previous studies investigated the behaviour of PPs realized according to international standards which require different composition of the porous systems. In details, the hydrological behaviour of the three PP samples to ordinary, moderate, severe and extremely severe rainfall events has been explored. The three samples (A, B, C) have been produced in the laboratory according to the technical specifications used by industries to ensure compliance with the legislative safety requirements and they differ in terms of composition (percentage of bitumen and aggregates) and, consequently, in the values of void ratio which necessary affects the hydrological properties and behaviours of the samples. After a mechanic characterization of the samples, attention has been focused on their hydrological response, in terms of runoff production, to rainfall events with intensities of 5, 10, 20, 30 mm/h and duration of 10 min, reproduced in a laboratory using a rainfall simulator. Subsequently, the physically-based model HYDRYS-1D has been calibrated using the experimental data collected during the laboratory tests. The optimal calibration parameter set has been found by iteratively optimizing the differences between observed and modelled data until getting the highest NSE. A sensitivity analysis of HYDRUS-1D has been performed in order to investigate the model response to variation in the values of input variables. A One-factor at a time sensitivity analysis, so called as each factor is perturbed in turn, has allowed to identify the most influential parameters.
The results of the analysis show that the RC of the PP samples ranges between 85% and 20% with higher values for low-intensity events and lower percentages for more severe events. The samples A and B exhibits similar behaviour while sample C is less performing. This result is consistent with the values of the void ratio that are 28% (sample A), 25% (sample B) and 12% (sample C) indeed, a low void ratio has repercussions on the retention capacity of the samples implying a reduction of this variable. The calibration procedure returns a set of input parameters corresponding to very high NSE values close to 1, which means a large model accuracy. It follows that HYDRUS-1D can be effectively used to reproduce the hydrological response of PPs during rainfall events with different intensities. The sensitivity analysis has allowed identifying the less influential parameters on the model results. The residual water content θr, and the tortuosity coefficient L with a global sensitivity index S respectively of 0.03 and 0.015 have proved to little impact the model outcomes while the most important parameter is the saturated hydraulic conductivity Ks (S=0.57) followed by α (S=0.52), θs (S=0.46) and n (S=0.42). The local sensitivity index is highly dependent on the rainfall intensity of the events indeed, the higher the intensity, the lower the impact of the parameter on the model simulation results. In conclusion, the high retention coefficients detected during the lab experiments, confirm that the PPs are an effective tool to reduce surface runoff so as to deal with the increasing challenge of urban flooding. In addition, the hydrological response of this kind of LID practices can be accurately reproduced by commercial software as HYDRUS-1D. The opportunity of a correct simulation paves the way for a successful analysis of the proposed technology at larger spatial and temporal scales.
CONSENT FOR PUBLICATION
Not applicable.
AVAILABILITY OF DATA AND MATERIALS
Not applicable.
FUNDING
None.
CONFLICT OF INTEREST
The authors declare no conflict of interest, financial or otherwise.
ACKNOWLEDGEMENTS
Authors will to thank SOCOTEC Italia Pavement Division Laboratory for providing materials and equipments necessary to the mechanical and hydraulic characterization of the permeable pavements samples used in the reported study.

