All published articles of this journal are available on ScienceDirect.

Mechanical and Functional Property Investigation of 2-Layered Pervious Concrete
Abstract
Background:
Pervious concrete pavements are considered one of the well accepted stormwater management strategies as per environmental protection agencies. The interconnected pore structure in the pervious concrete allows the stormwater to percolate and thus reduce the runoff.
Methods:
The laboratory and field investigations on the pervious concrete pavements have shown that the abrasion and clogging are major distresses that reduce the functional performance of these sustainable pavements. The open graded structure of the pervious concrete undergoes ravelling due to vehicular movement and they may also allow the suspended particles in stormwater runoff to get clogged inside the pore structure. In this study, 2-layered pervious concrete was designed to balance the trade-offs between strength and durability. The porosity and density of 2-layered pervious concrete were found to be in the domain of conventional pervious concrete.
Result:
The failure pattern in compression indicated that the failure of the specimen was concentrated on the bottom layer compared to the top layer. Further, the compressive strength was found to be in the range of 11.90 to 20.0 MPa. The pore distribution at the interface of the top and bottom aggregate was found to follow 3-parameter Weibull distribution, where the scale parameter increased as the aggregate size increased. The abrasion resistance was found to be lower compared to conventional pervious concrete.
Conclusion:
Overall, it was found that 2-layered pervious concrete can be one of the alternatives to implement pervious concrete pavements addressing the demerits of conventional pervious concrete.
1. INTRODUCTION
The rapid increase in urbanization is leading to the expansion of road infrastructure, which is one of the prime causes of several environmental issues. The rate of conversion of natural ground and gravel roads into impermeable asphalt and concrete pavements indicates the high impact development (HID), which is undesirable in developing sustainable infrastructure. In such a scenario, conventional pervious concrete (CPC), also referred to as porous concrete or permeable concrete (PC) has been a promising material contributing to sustainability.
PC is a special concrete with porosity ranging from 15 to 35% and possesses interconnected pores for the percolation of water. CPC pavements have been used for over four decades in many parts of the world because of the benefits it offers, such as reducing stormwater runoff and increasing groundwater recharge [1, 2]. In addition to these, because of the porous nature, it is said to improve the groundwater quality by trapping the suspended solids, reduce noise pollution by absorbing the tire-pavement noise and also keeping the pavement surface cool and thereby lowering the urban heat island effect (UHI) [3].
Usually, PC mixtures are designed based on target total porosity of 15 - 35% rather than target strength as in conventional concrete [4, 5]. The total porosity consists of closed porosity, which refers to discrete pores, and effective porosity, which refers to connected pores [5]. From past studies, it is known that effective porosity constitutes about 50-70% of total porosity and majorly controls the permeability characteristics of PC [6, 7]. The permeability is the most important functional property of PC, which quantifies the ease with which the water can percolate through the porous medium. For the cylindrical specimens of PC, the permeability is often measured by using the falling head permeameter test setup in the laboratory. However, in the field, it is quantified by measuring the infiltration rate as per ASTM-C-1701 [8]. The permeability of PC is found to be in the range 0.003 – 3.3 cm/s [9].
The permeability is generally said to increase with the pore size, but few studies based on electrical conductivity principles highlighted the requirement of pore connectivity in addition to large pore size [10, 11]. The pore structure parameters such as pore shape and pore distribution are the factors to be considered in order to predict permeability. The pore shape and pore size distribution have been investigated using different methods, such as 2-dimensional and 3-dimensional image analysis. The images for processing and analysis are obtained from different techniques such as optical microscopy, X-ray tomography, etc [10, 12]. The past studies involving image processing and analysis, have found that the average pore size in PC specimens lies in the range of 2 mm to 8 mm [3, 10,12-14]. Neithalath et al. (2006) [10] used the electrical conductivity methods coupled with image analysis to predict permeability using pore parameters. Chandrappa and Biligiri [12] used 3D images from X-ray tomography and found that as the pore size increased, the permeability decreased. This indicated that large pore sizes do not necessarily result in higher permeability. Interestingly, the surface area of pores had a very good relation (R2 = 0.8025) with permeability than the pore size (R2 = 0.0406). Debnath et al. (2021) [3] used 2D image analysis to study the pore distribution of the PC made with over burnt brick aggregates (OBBA) of different gradations. The permeability predicted using the Kozeny-Carman equation, considering the specific surface area (SSA) obtained from image analysis, was found to be in a good match with experimentally measured permeability.
The porosity is also known to affect mechanical properties such as compressive strength and abrasion resistance in PC. The compressive strength of PC is generally measured by the unconfined compression strength test (UCS) in accordance with ASTM C39 [15]. The most commonly reported compressive strength of PC mixtures varies from 3.8 to 30 MPa with a w/c ratio of 0.27 to 0.33 [4, 16, 17]. As a surface layer, the compressive strength of 17.0 MPa makes it sufficiently strong enough to carry lighter traffic loads such as passenger cars and occasional trucks [18-20]. Deo et al. (2010) [21] found that an increase in 10% porosity resulted in 50% reduction in compressive strength. Further, PC mixtures made with smaller size aggregates exhibited failure much earlier than that with larger aggregates when subjected to compression test [21]. Although few recent studies show that the strength can be significantly increased by the addition of supplementary cementitious materials (SCM’s) and polymer additives, increasing compaction effort [2, 22], there is always a chance of losing the interconnected pore structure, which is expected to contribute to the permeability. Therefore, the main objective of the mixed design of PC should be to maintain a balance between the desired functional properties and the strength requirements.
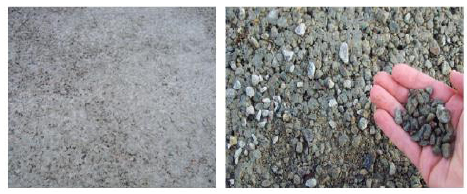
Field studies have shown that the conventional PC pavement layers are prone to durability issues such as clogging and raveling, as shown in Fig. (1). Due to open texture and the presence of coarse aggregates, raveling takes place due to the movement of vehicles. The loss due to raveling/abrasion is quantified in terms of mass loss using the Cantabro test [23]. The abrasion loss is observed to be controlled by the aggregate gradation, which in turn has an effect on the pore size. The large pore size at the top surface of PC can be seen in the mixtures prepared with large aggregate sizes. In the study by Sahdeo et al. [2], the abrasion loss (measured by Cantabro test) was found to be more in the PC mixtures having lower density and higher void content, indicating that the pore volume is an important factor in order to limit the abrasion loss. Also, in the study by Wu et al. [24], the conclusion was made that the abrasion resistance is higher in the PC mixtures made up of smaller grain size aggregates. Further, the addition of silica fume, polymers and fibres is found to increase the bond strength and thereby increase the abrasion resistance [25]. Further, the pores of PC at the pavement surface allow the periodic settlement of fines and debris, which comes along with the stormwater and chokes the surface of PC. The process is known as clogging, and it is known to significantly reduce the functionality of PC. However, previous studies indicate that clogging is a function of both pore size and clogging particle size [14, 26-30].
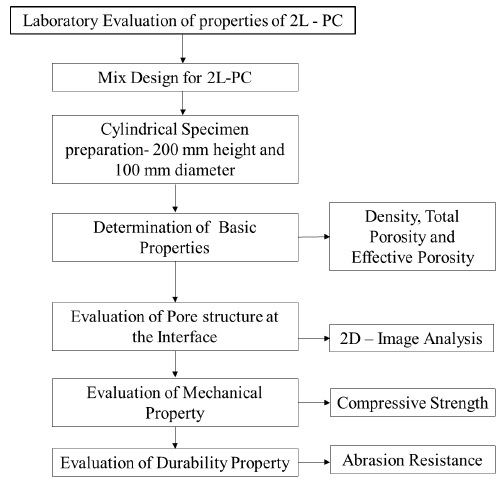
Summarizing the above observations, the conventional pervious concrete undergoes abrasion and clogging during its service life resulting in the reduction of the functional life. In order to address this, there is a need to modify the methodology in which pervious concrete is fabricated. In this direction, the main objective of this study is to design pervious concrete as a two-layered mixture and evaluate its mechanical and functional properties. The research outline is shown in Fig. (2).
2. RESEARCH SIGNIFICANCE
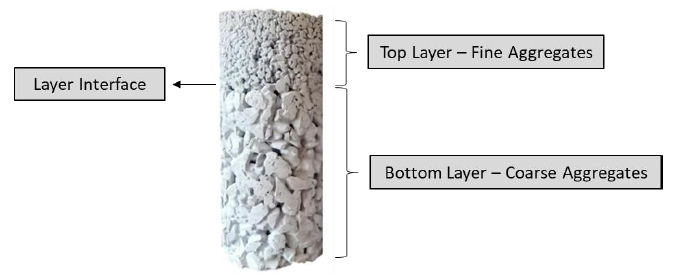
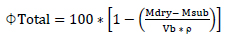
The conventional pervious concrete undergoes abrasion and clogging during its service life resulting in structural and functional degradation. As seen from the literature, there is a trade-off between the mixture of design parameters and performance. The conventional pervious concrete with coarser aggregates results in high permeability but lower compressive strength and abrasion resistance. On the contrary, the finer size pervious concrete results in higher strength and abrasion resistance but lower permeability. In order to balance this trade-off, in this study, two-layered pervious concrete was conceptualized. The top layer comprises single-sized aggregates of relatively finer size, which is expected to help in improving abrasion resistance as a large open matrix at the surface is not directly exposed to vehicular loads. The bottom layer consists of relatively coarser aggregate with higher permeability. The top and bottom layer aggregate sizes should be carefully selected such that the interface between these two layers should not get choked due to packing. The typical two-layer pervious concrete (2L-PC) is shown in Fig. (3). Since it is relatively new compared to conventional concrete, the strength and abrasion resistance of 2L-PC need a thorough investigation.
3. MATERIALS AND METHODS
3.1. Materials
3.1.1. Aggregates
The aggregate sizes used in this study included: 19 to 13.2 mm, 13.2 to 9.5 mm, 9.5 to 6.7 mm, 6.7 to 4.75 mm, and 4.75 to 2.36 mm. The physical properties of the aggregates are shown in Table 1. The aggregate size combinations for the top and bottom layers were selected on the basis of AutoCAD drawings such that there exists continuity of pores from the top to bottom layer. The layer combinations, as shown in Table 2, possessing a minimum porosity of 20% at the interface, were considered for the experimental study.
| Physical Property | Test Value |
| Aggregate Crushing value,% | 25.04 |
| Aggregate Impact value, % | 28.57 |
| Los Angeles Abrasion value, % | 12.68 |
| Specific Gravity | 2.785 |
| Sample Identification | Aggregate Size, mm |
| Sample 1 | 9.50 |
| 13.2 | |
| Sample 2 | 6.75 |
| 9.50 | |
| Sample 3 | 4.75 |
| 6.75 | |
| Sample 4 | 6.75 |
| 13.2 | |
| Sample 5 | 4.75 |
| 9.50 | |
| Sample 6 | 2.36 |
| 4.75 |
| Sample No. | Layers | Cement(C) ( kg/m3) |
Aggregate (A) (kg/m3) | Water (W) (kg/m3) | Admixture (kg/m3) | C:A:W | A/C |
| 1 | Top | 432.85 | 1340.14 | 129.86 | 2.164 | 1:3.09:0.30 | 3.09 |
| Bottom+ | 412.90 | 1340.14 | 136.26 | 2.064 | 1:3.24:0.33 | 3.24 | |
| 2 | Top | 401.51 | 1394.34 | 120.45 | 2.007 | 1:3.47:0.30 | 3.47 |
| Bottom | 383.01 | 1394.34 | 126.39 | 1.915 | 1:3.65:0.33 | 3.65 | |
| 3 | Top | 378.28 | 1434.53 | 113.48 | 1.891 | 1:3.79:0.30 | 3.79 |
| Bottom | 360.84 | 1434.53 | 119.08 | 1.804 | 1:3.97:0.33 | 3.97 | |
| 4 | Top | 414.80 | 1371.36 | 124.44 | 2.074 | 1:3.30:0.30 | 3.30 |
| Bottom+ | 395.68 | 1371.36 | 130.58 | 1.978 | 1:3.46:0.33 | 3.46 | |
| 5 | Top | 390.45 | 1413.47 | 117.14 | 1.952 | 1:3.62:0.30 | 3.62 |
| Bottom | 372.46 | 1413.47 | 122.91 | 1.862 | 1:3.79:0.33 | 3.79 | |
| 6 | Top | 389.71 | 1414.75 | 116.91 | 1.948 | 1:3.63:0.30 | 3.63 |
| Bottom | 371.75 | 1414.75 | 122.68 | 1.858 | 1:3.85:0.33 | 3.80 |
3.2. Methods
3.2.1. Mix Design and Sample Preparation
The pervious concrete mix design was carried out in accordance with the National Ready Mix Concrete Association (NRMCA) guidelines [31] but separately followed for the top and bottom layers. The samples were designed for the target design air voids of 25% considering w/c ratio of 0.30 and 0.33 for the top and bottom layers, respectively. The mix proportions are indicated in Table 3.
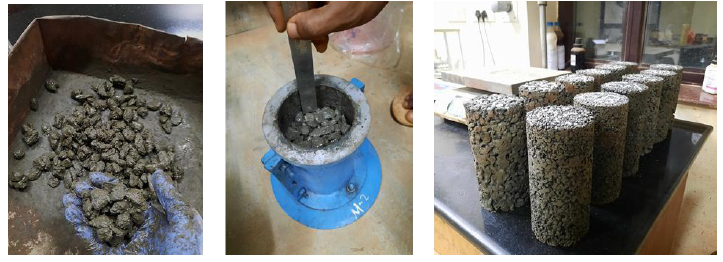
In order to prepare the specimens of cylindrical geometry (height 200 mm and diameter 100 mm), firstly, the cement and aggregates were mixed thoroughly to form a dry mix. Then the water containing the superplasticizer was added in small amounts as the mixing continued. The fresh mix was immediately poured into the cylindrical mold as a single layer occupying 170 mm (decided on a trial basis) and then compacted by giving 25 blows with a standard proctor hammer (2.5 kg). This allowed the mix to get compacted and attain the required layer thickness of 150 mm. The same procedure was adopted for placing the top layer as well. It was taken care that the time difference between the placing of two layers did not exceed 10 minutes. The specimens were demolded after two days of casting to ensure the proper setting and bonding. All the specimens were then water cured for seven days. The process followed is shown in Fig. (4).
3.2.2. Determination of Density, Total Porosity, and Effective Porosity
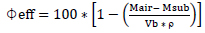
The basic properties of PC specimen, namely density and porosity, were determined based on the buoyancy principle using the ASTM C1754-12 method [32]. The seven-day-cured specimens were shifted to the water tank and kept immersed for 12 hours. After 12 hours, the specimens were then continuously agitated inside the water vessel for a time period of 20 minutes to remove air bubbles. After verifying that there were no air bubbles, the specimen's submerged mass (Msub) was recorded inside the water bath. Then the specimens were allowed to air dry 24 hours in order to note down the air dry mass (Mair) followed by oven drying for 5 days at 50 oC to record the constant oven-dry mass(Mdry). The effective porosity (φeff) and total porosity (φTotal) were then calculated by using Equation (1) and Equation (2), respectively.
 |
(1) |
 |
(2) |
Where,
Vb = bulk volume of the specimen, m3
ρ = density of water, kg/m3
Mair = air dry mass of specimen, kg
Mdry = oven-dry mass of specimen, kg
Msub = submerged mass of specimen, kg
3.2.3. Image Acquisition and Processing
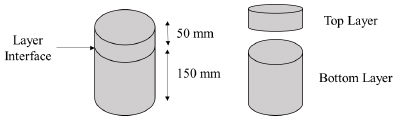
The analysis of pore features at the interface of two-layered pervious concrete specimens was carried out by using 2D- scanned images. The cylindrical specimens were cut exactly at the interface of the top and bottom layers and sectioned into two slices, as shown in Fig. (5). On the obtained cut surfaces, in order to make the thresholding easy, the white painting was applied on the cement-aggregate matrix and then scanned using a flatbed scanner of resolution 600 dpi. The cut sections before and after the white painting are shown in Fig. (6).
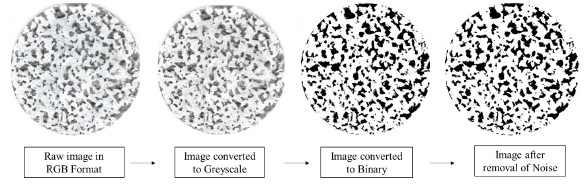
The processing of acquired images was carried out using a freely available image processing tool called “ImageJ”. The images in color format (RGB) were first converted into Greyscale. The median filtering technique (radius = 5 pixels) was used to smoothen the paintbrush marks. The filtered images were converted to binary following the thresholding process to restrict the voids and solids in the matrix. In this study, the voids and solid matrix are shown with black and white color, respectively. The entire process is represented in Fig. (7).
As measurement in the images is expressed in terms of pixels, a length scale was set for the processed images by indicating the known diameter of the sample, i.e., 100 mm on the image. This ensured the calibration of the image, and all the measured parameters were expressed in millimeters. The pore parameters, such as porosity in the plane of the image, pore size in terms of area, and equivalent size of the pore assuming circular shape were calculated for each image. Although, the pore shapes are different from that of a circle, an equivalent radius can be calculated for every pore, assuming them to be circular in shape. Similar procedure was adopted for each of the sample, and pore area measurements were obtained considering both the top and bottom images.
3.2.4. Measurement of Compressive Strength
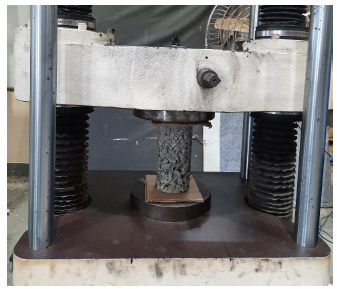
The unconfined compressive strength (UCS) of the 7-day cured pervious concrete specimens were tested in a universal testing machine of 600 kN capacity, which is operated in a stress-controlled mode. The rate of loading was set at 0.25 MPa/s confirmed to ASTM C39-15 [15]. Cardboard of sufficient thickness was placed in between the loading surface and the specimen in order to overcome the limitations associated with surface preparation for uniform stress distribution. The test setup is shown in Fig. (8).
3.2.4.1. Measurement of Abrasion Resistance
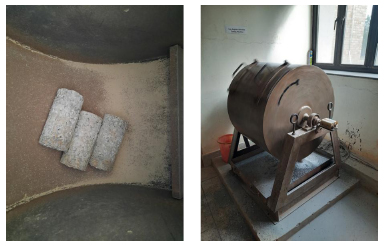
The abrasion resistance of the two-layered PC and conventional PC mixtures was determined using Cantabro loss Test. Three oven-dried samples of each gradation were placed in the Los Angeles abrasion testing machine and were run for 500 revolutions as per ASTM C1747 [23], as shown in Fig. (9).
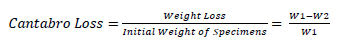
Due to the continuous impact, the aggregate particles get loosened, and the cylindrical specimens deteriorate as in pavement surface, which is subjected to vehicular loads. The abraded specimens were then passed through 1 inch (25 mm) sieve, and the weight of material retained on the sieve was noted down. The Cantabro abrasion loss was calculated using Equation (3).
 |
(3) |
Where,
W1 = Initial Oven Dry weight of Specimens, kg
W2 = Weight of specimens retained on the 25 mm sieve, kg
4. RESULTS AND DISCUSSION
4.1. Image Analysis
4.1.1. Pore Size and Distribution
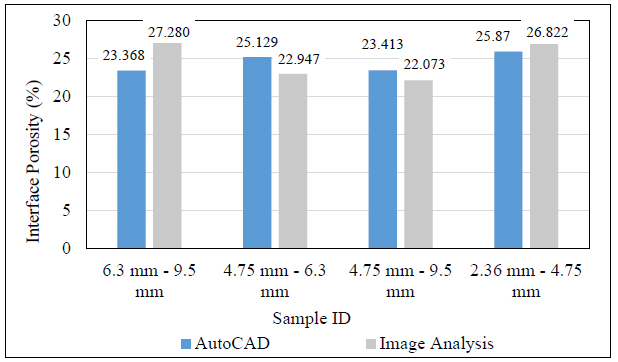
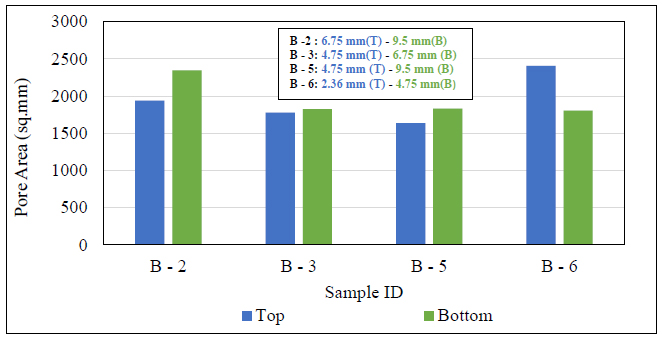
It is observed from the previous literature that the porosity controls various other fundamental and functional properties of PC and thereby the material response. The porosity is said to vary from one mixture to other and is highly dependent on the aggregate gradation and cement paste volume. Therefore, the main objective of this study was to understand the pore parameters like the size, shape, and distribution at the interface of the top and bottom layer as there is a high chance of blocking the path for water flow by the aggregates of the upper layer due to the size difference. The results from the image analysis indicated the presence of required pores at the interface in order to maintain functionality. The porosity at the interface obtained from the image analysis was also found to be in an excellent match with the average interface porosity predicted using the 2D-AutoCAD model for the same specimens (Fig. 10). It is also evident from Fig. (11 and 12), that there exists a difference in the pore size, area, and distribution at the interface of 2L-PC specimens. As seen in Fig. (12), the top layer shows slightly lower porosity except for B6, in which the total pore area at the top was found to be lower than the bottom. Lower porosity in the top layer may be attributed to the fact that this layer is made up of finer-sized aggregate and also the compaction energy imparted is higher for a given volume compared to the bottom layer. Further, higher porosity in the top layer for the B6 mixture can be attributed to the resistance given by 2.36 mm aggregate size for compaction due to finer size [25].
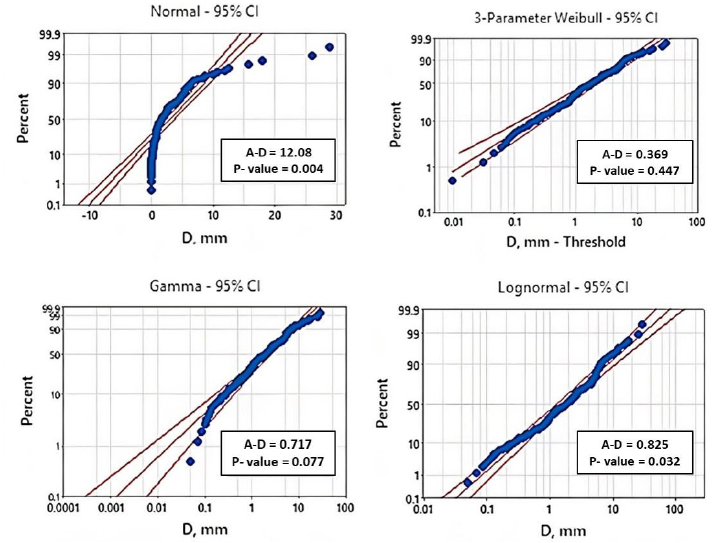
The equivalent diameter of pores were extracted from the image analysis. It varied in the range 0.050 mm to 15.53 mm in the top layers and 0.050 mm to 28.92 mm in the bottom layers. In order to understand the pore size distribution, statistical analysis was carried out to identify the distribution which would describe the distribution of pores. The well-known distributions such as normal, Gamma, Weibull, and lognormal distribution was fit to the pore sizes. The Anderson-Darling statistic (A-D) was used to check the hypothesis that the data followed a specific distribution. According to Anderson-Darling, the lower the value of A-D statistic, the better the fit. From the plots shown in Fig. (13), it is clear that the representative dataset of Sample B-5 bottom fits into 3 – Parameter Weibull distribution at a level of confidence of 95%. The observations were similar for the rest of the samples as well. In addition to this, the previous studies made by Deo and Neithalath (2010) [21] also proved that the pore size distribution in pervious concrete confirms to 2 – Parameter Weibull distribution. However, since there will be a minimum pore size, the three-parameter Weibull distribution will describe the distribution more accurately, with its location parameter, in addition to the scale and shape parameters [3, 16].
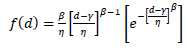
In order to understand the nature of the distribution, the pore sizes of both top and bottom layers of all the samples were modelled using the 3-Parameter Weibull distribution. The related probability distribution function (PDF) and cumulative density functions (CDF) are given in Equations 4 and 5, respectively.
 |
(4) |
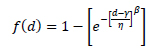 |
(5) |
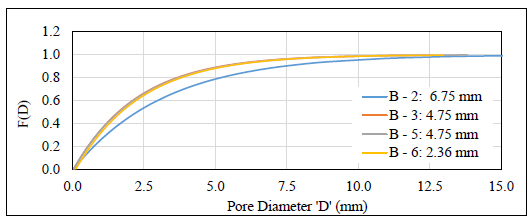
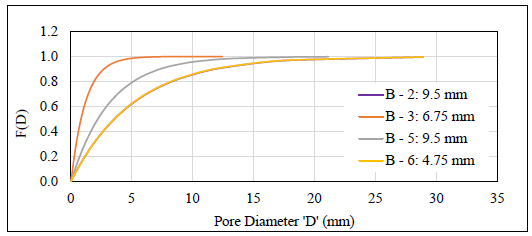
For f(d) >0, d >0, β >0 and η >0. Here, d represents the pore diameter, β is the shape parameter, which defines the slope of the density curve, η is the scale parameter, which shows the flatness/ spread of the curve between any given interval and γ is the location parameter, which indicates the minimum value of the data points. The PDF and CDF curves for the pore distribution are shown in Fig. (14 and 15), respectively.
| Sample ID | Gradation | A-D Value | β | η | γ | |||||
| Top | Bottom | Top | Bottom | Top | Bottom | Top | Bottom | Top | Bottom | |
| 2 | 6.75 | 9.50 | 1.612 | 0.874 | 0.779 | 0.810 | 2.503 | 4.167 | 0.044 | 0.022 |
| 3 | 4.75 | 6.75 | 0.312 | 1.831 | 1.029 | 0.880 | 2.673 | 1.978 | 0.049 | 0.045 |
| 5 | 4.75 | 9.50 | 1.139 | 0.672 | 0.963 | 0.807 | 2.206 | 2.558 | 0.040 | 0.039 |
| 6 | 2.36 | 4.75 | 2.627 | 1.062 | 0.996 | 0.763 | 1.651 | 3.885 | 0.046 | 0.031 |
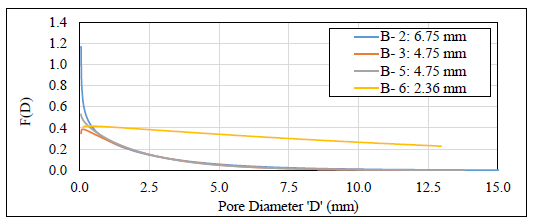
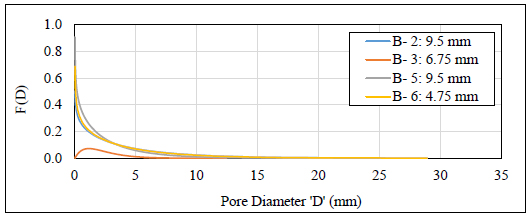
Fig. (15a and 15b) show the cumulative distribution plots for the top and bottom layers of different samples, which indicate the probability of occurrence of particular pore size. In the layers made with aggregates of larger sizes (9.5 mm and 6.75 mm), the concentration of small pore sizes is relatively low, when compared to that of layers made with aggregates of small sizes (2.36 mm and 4.75 mm). The results of statistical pore distribution will be extremely helpful in simulating flow through pervious concrete using computational methods such as discrete element methods (DEM) and computational fluid dynamics (CFD).
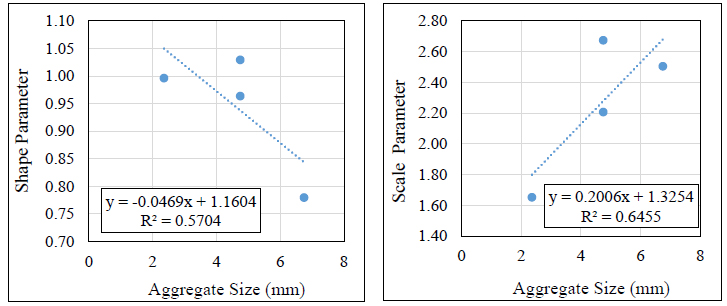
The A-D statistics and the Weibull parameters obtained for the pore size datasets are listed in Table 4. The variation of these parameters with the aggregate size is presented in Fig. (16).
It may be observed from Fig. (16) that as the pore size increases, the shape parameter decreases, whereas the scale parameter increases with the increase in the pore size. This clearly indicates that in the case of the coarser aggregate PC mixtures (bottom layer), the distribution of the pores is heterogeneous, whereas in case of finer aggregate PC mixtures (top layer), it is rather homogeneous. As the scale parameter increases, there will be a tendency for deviation from the Darcy’s law as the pores are distributed heterogeneously, leading to increased velocity head [7]. Therefore this observation has a significant impact on the flow of water through the pervious concrete.
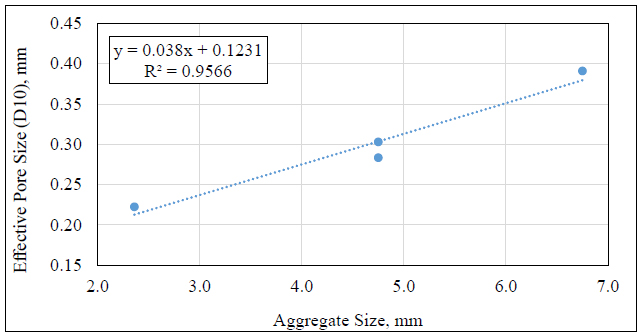
To understand this distribution better, the distinct or effective pore size “D10” of the top layer was calculated from cumulative frequency distribution curves for each of the layers. The value of D10 denotes the effective pore size, where 90% of pores have sizes larger than D10. A good correlation was observed between the effective pore size and the aggregate size Fig. (17). It may be seen that D10 increases with the increase in aggregate size.
4.2. Compressive Strength
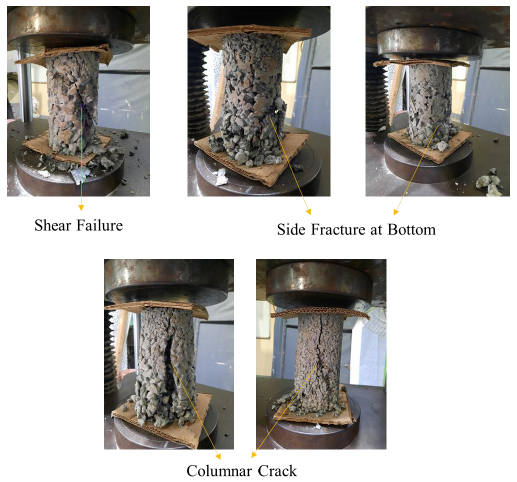
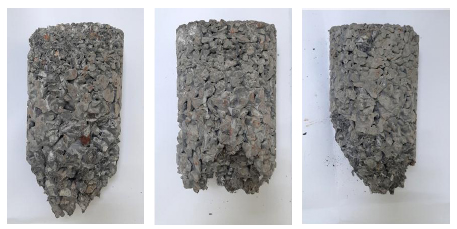
The 2L-PC specimens tested after 7 days of curing reported a maximum unconfined compressive strength of 20 MPa and a minimum of 11.90 MPa. However, the average UCS values for the sample 1, 2, 3, 4, 5 and 6 were obtained as 12.10 MPa, 15.30 MPa, 11.20 MPa, 14.40 MPa, 13.10 MPa, and 18.60 MPa, respectively. The failure patterns of samples are shown in Fig. (18). Samples made with larger aggregate (6.75 mm and 9.5 mm) size at the top layer showed both shear and side fracture type of failures, in which cracks propagated diagonally throughout the specimen/or only at a side portion keeping the top faces intact. However, in the case of samples made with fine aggregates (2.36 mm & 4.75 mm) at the top layer, columnar cracks propagated vertically and evenly around the specimen. An important observation is that the cracks were not identified at the interface of 2 layers which shows that the 2L- PC specimen behaves as a single entity as it was fabricated as the wet-on-wet condition. Further, most of the specimens did undergo failures by complete crushing of the bottom layer only, which is evident from Fig. (19). This indicates that providing a finer aggregate pervious concrete at the top layer, will improve the load- bearing capacity, where the stresses are high due to the vicinity of the tires.
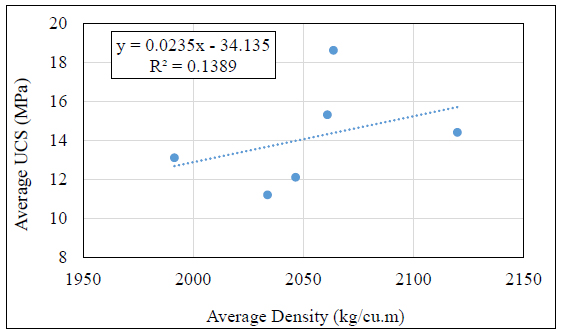
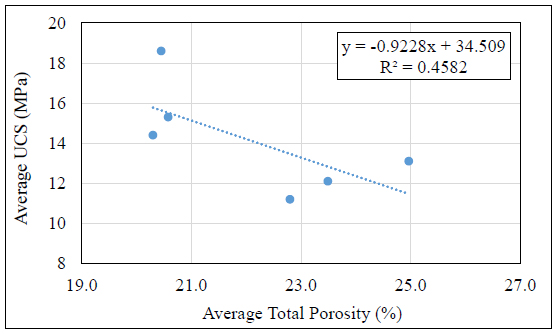
The average UCS was found to be linearly increasing with the hardened density and decreasing with the total porosity of specimens (Fig. 20 and 21) which is a good match with previous works [4, 5, 21, 30].
4.3. Abrasion Resistance
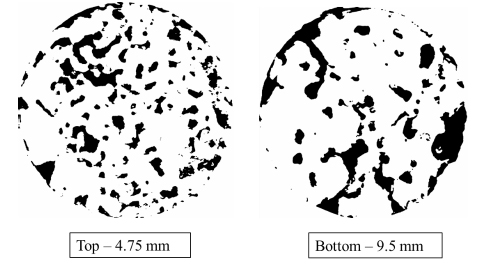
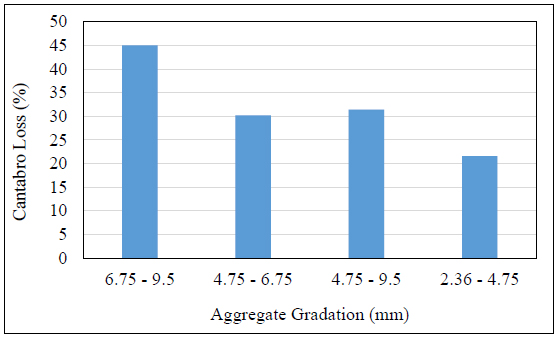
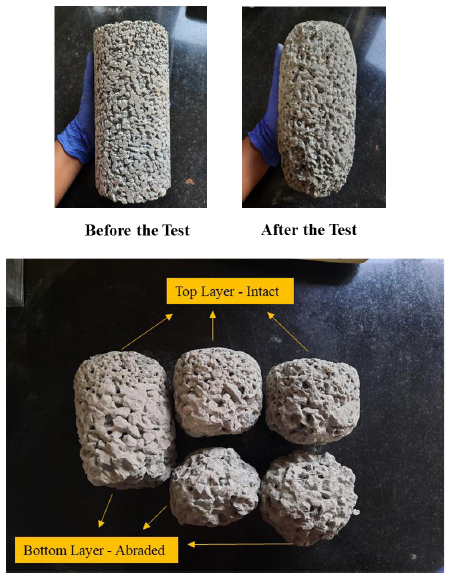
The abrasion test results showed that the 2L-PC specimens are highly resistant to abrasion as the Cantabro loss values were found in the range of 21% to 45%. It clearly indicates that the loss of material due to abrasion was lower as the size of aggregate particles reduced Fig. (22). As depicted in Fig. (23), the top layer made up of 6.75 mm aggregate size possesses large open voids in the matrix and therefore gets easily abraded. However, the top layer, made up of 2.36 mm and 4.75 mm, gives a compact structure that holds the matrix together and leads to less degradation. This indicates that altering the fabrication process of pervious concrete may result in a more durable alternative than the conventional single-layered pervious concrete for the pavement applications, without compromising strength and porosity characteristics.
5. DISCUSSION
With the pervious concrete pavements gaining attention for its sustainability benefits, design procedures are evolving to improve the performance. The abrasion and clogging are considered the main demerits of conventional pervious concrete, which has limited its application. This study devised a simple procedure to design 2-layered pervious concrete as an alternative to conventional pervious concrete. The mechanical and abrasion characteristics investigated in this study have shown that 2-layered pervious concrete possess similar strength but enhanced abrasion characteristics relative to conventional pervious concrete. Further, the pore structure characteristics investigated in this study provide new insights for the modeling of pervious concrete pore structure for simulation study. Future studies shall investigate the clogging behavior of 2-layered pervious concrete followed by rejuvenation methods to quantify its anti-clogging abilities.
CONCLUSION
The main objective of this study was to investigate the mechanical and functional properties of novel 2-layered pervious concrete as an alternative for the conventional pervious concrete. Based on the laboratory investigations carried out under this study and the statistical analysis, the following conclusions could be drawn:
- The pore size distribution at the interface of top and bottom layer follows 3-parameter Weibull distribution. The scale parameter increases as the size of the aggregate in pervious concrete increases.
- The statistical distribution of pores obtained in this study can be used in simulating the flow of water through pervious concrete.
- The comparison between the porosity at the interface determined using image analysis and that determined using AutoCAD drawings was found to be similar, indicating the methodology adopted is robust.
- The image analysis indicated that the porosity at the top surface is lower than that of the bottom surface at the interface region. This indicates that the clogging material may not easily enter the bottom layer due to lower porosity at the top.
- The compressive strength failure pattern in 2L-PC indicated that the failure occurs at the bottom layer of the specimen. This will ensures that the top layer remains intact, where the stresses are generally higher due to vicinity of the wheel loads.
- The abrasion resistance is better in 2L-PC compared to conventional PC as observed from the literature.
LIST OF ABBREVIATIONS
| HID | = High Impact Development |
| CPC | = Conventional Pervious Concrete |
| PC | = Permeable Concrete |
| UHI | = Urban Heat Island Effect |
CONSENT FOR PUBLICATION
Not applicable.
AVAILABILITY OF DATA AND MATERIALS
The data supporting the findings of the article is available within the article.
FUNDING
None.
CONFLICT OF INTEREST
The authors declare no conflict of interest, financial or otherwise.
ACKNOWLEDGEMENTS
The authors acknowledge IIT Bhubaneswar for funding this project vide project number SP 100.

